
Update: this post was picked up by Zerohedge and Goldseek; here is the Zh version, which is always good for racy comments
Originally on marketslant.com
For What it is Worth: We are buying Gold in our small family fund. This is a trade, not an investment. Potentially a much longer term trade for us than normal, possibly a 12 month hold as opposed to our 3 day positions. We are buying physical in quantities that will not need to be sold if we are wrong, thus no leverage. We will also be swing trading gold with an upward bias as our indicators dictate below $1260 or above $1306.
Target picking is risky in an asset whose value is largely based on sentiment and prone to being "jawboned" into its proper place. But we believe for various reasons that if Gold does not pierce $1260 spot, its chances of a rally topping between $1450 and $1700 are strong over the next 12-18 months. The wide target range reflects the emotional factor in Gold's behavior far outweighing supply, production costs, and its lack of fundamentals to measure using tools like EBITDA, PE, and cash flows. And our own analysis is corroborated from several different disciplines who we did not seek out to rationalize our own bias. Those analysts we respect have a collective range as high as $1850 with downside risk to $1135. We'd be happy to sell at $1650 if we are right.
For us, it's just a trade. But it's a very good and very rare risk/reward trade. It has set up right now. Further, it will either be violently and decisively confirmed (or negated) above $1306 or below $1260 not in that order. And holding an asset for 18 months is not an investment by our standards. Please get off our lawn if you think it is!
Trading Gold Long Term is Not Investing.
Buy and Hold vs. Using a “Go to Cash” Filter is key in treating Gold as a trading vehicle and not an investment. It stores wealth, it isn’t a growth or income vehicle.
Why are we sharing this? That same question should be asked of Ray Dalio, Jeff Gundlach and others who announce they are bullish on Gold after they have bought. Our own position is not relevant to the market overall and we do not need to market our tiny positions to create an exit strategy a la George Soros. The premise for the trade happens so rarely its worth writing about, if for no other reason as an exercise in outsourcing our self-discipline on the trade.
Vince Lanci for SKG
Here is how we came to be this way.
Step 1: Volatility is Coiling
When trading short term periods, intraday and intraweek, we use a volatility system for alerts to incipient movement. We risk 1 to make 2 and move on when wrong. It works about 50% of the time. it is net profitable. And best of all, positions that are in limbo are closed expeditiously. This is after all a volatility system. No vol, no position. It's been cited here many times in the past. When it is right, it is very right. when it is wrong, you are out. Past posts and a 25 year track record of use bear this out from our active days. The bottom of this post goes into more detail on its use.
What we never did at Echobay or its predecessor fund CIS Energy, was use it on long term charts. We certainly looked at them, but only for bias in shorter term trades. Last month we took a serious look at our VBS algorithm on a monthly chart. Here is what we found:
Updated from : Gold Macro Analysis: A November to Remember
Gold has a tremendous risk reward setting up above $1306 or below $1260..... which way from there is not known but can be handicapped once either number is breached

for a nexplanation of VBS see bottom Appendix
Step 2: How Equity Funds Play Gold
Portfolio managers at large equity funds who have contributed here anonymously use systems that advise them when being in cash as opposed to long stocks is prudent. What is also known is that funds like these punt gold positions with their discretionary in-house money for fun.
They use similar systems for entry and exit, and never risk much in their positions. Gold is a hobby to these guys. As a result, they like to buy and walk away with long term trade orientations and firm stops. This means using long term moving averages to avoid noise. We know this is true. And here is an example of how that type of positions is implemented:
In a recent interview a vocal critic of the Gold industry explained why he was buying Gold
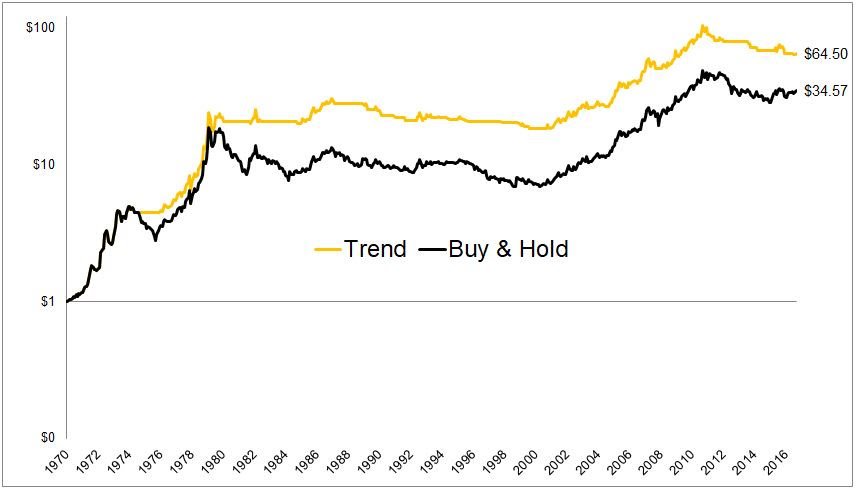
…Gold is poised to close above its 12-month moving average for the second straight month. Going back to 1970, the average monthly return for gold following a close above the 12-month moving average is 1.47%. The average monthly return following a close below the 12-month moving average is -0.15%.
If you used the simplest of trend-following methods, investing in gold when it was above its 12-month moving average, and going to cash when it is below, the results would have been far better than just buying and holding gold. He continues:
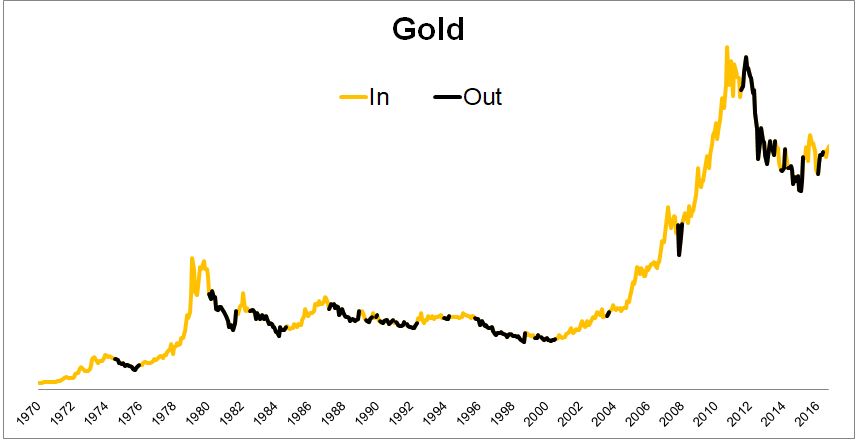
The chart below shows when you would have been invested in gold and when you would have been out. Granted, prior to GLD, this could only have been done with futures contracts, or gold bullion, with the former adding a degree of leverage that I would not have been comfortable with, and the latter adding a degree of paranoia that also would have made me uncomfortable.
Full post : Vocal Critic Explains Why He is Buying Gold
About Physical vs. ETF: While we agree with the rationale behind GLD vs futures if you are trading and not investing, we feel for multiple reasons the physical gold market is going to open up and become a serious competitor to ETF allocations within 12 months. Specifically, blockchain products are coming, and if properly implemented as a pipeline, owning physical gold not held in trust by a GLD custodian will be as easy as clicking a mouse. You will buy and sell physical Gold that will be yours and verified via the blockchain system.
So for us, physical gold now has the benefit of increased liquidity on the horizon, which means increased transactions and exposure. Which ultimately means decentralization of the Gold market from a few large firms to grass roots stackers, owners, and value preservers. We view emerging technologies as putting physical assets in a position to have their true value unlocked. Whether that be the tea farmer in India who can't currently get a loan on his land due to government rules, to Silver whose value is somewhat disconnected from its price. The effect will not be unlike when a private company goes public. Accessibility and liquidity creates safety and increases demand. Owning physical metals is like owning a beneficiary of technology down the road.
Monthly Chart Through July 2017 using the 12 Month MA described above
Step 3: Optimizing the Simple 12 month MA Tool
by optimizing the MA with one factor we back tested greater successes when in trades. Conversely, we were also in less trades. On balance it was a wash. But right now the employed filter says the 12 Month MA has bigger upside than the average if profitable at all. A rare chance to buy close to the level the fund punters did with a statistical chance of greater profits than the 1.47% monthly average generated by the original backtest.
Updated and Optimized by the Author

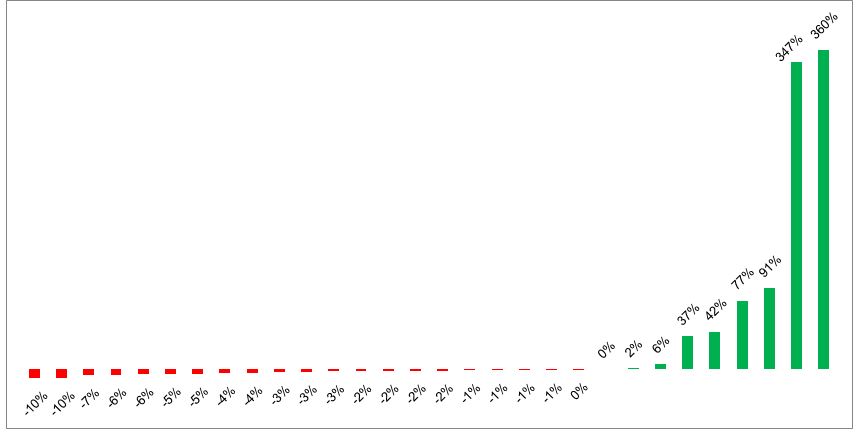
The chart below shows the hypothetical results from each of the 30 exits following an entry (going back to 1970). Using these rules would have resulted in a loss two-thirds of the time. But as you can see, the losses have been relatively shallow, not exceeding 10%, while the gains have been good to extraordinary.
Step 4: Using VBS for Confirmation of Direction
Simply put: If we get a VBS signal trigger when $1306 trades, a decision must be made to add, sell, or hold based on the data that comes with the signal. If we get one on a $1260 print, the same must be assessed.
Step 5: Actions
- We are buying Gold now based on the "Fund Finder" signal with a monthly stop out below the yellow line in that chart above.
- $1306- we will consider adding a shorter term amount in a rally if the monthly VBS is triggered higher
- $1260- we will consider either adding physical, or selling paper Gold for swing trading purposes if the VBS is triggered lower.
- Per #1- we will close or hedge the first physical purchased on a monthly settlement below $1244 - the wide berth on monthly exits necessitates no leverage
Bonus: Moor Analytics comes to a similar conclusion from a different perspective.
Moor Analytics: Gold Downside May Finally be Exhausted
Within the overall bearishness I noted that a possible area of exhaustion for this move down from 13624 comes in at 12732-644. We basically held this, but with a $1.6 violation, and rallied to 13084 before rolling over and rejecting from it again (although this time down the 12628 was simply support, not exhaustion)
And Michael's most recent weekly report of Nov. 10th
Via Moor Analytics:
I would note that we broke above a well-formed macro line in the week of 8/7 that came in at 12629. The break above here projects this upward $183 minimum, $501 (+) maximum—the maximum to be attained likely within 9-12 months. This line comes in at 12357 today. I am late to the game on this, but we were only $18 from the original breakout when I mentioned this, and have a lot of room to go in the projection.
Appendix
What is VBS?
- Volatility Based Risk Reward Generator
+ Originally developed as an alert to when the risk of being short implied volatility is larger than being long it, and vice-versa + It is a probability model that handicaps risk reward + As a by-product of its original purpose, it gives risk/reward scenarios in market direction. + Due to its accuracy in predicting volatility expansion, directional applications are right or wrong quickly and is very useful in efficient use of capital
How VBS Works
- Time is precious, Price is noisy, Volatility is less so.
+Volatility is less noisy than price, therefore more reliable as an indicator. +Volatility cycles more cleanly and can be seen to "inhale and exhale" when viewed graphically with Bollinger Bands +VBS is based on several relationships between historical and implied volatility across different time frames + It can be applied by traders on any time frame
VBS and Direction
- It doesn't predict price, only speed of movement
+It gives non-directional alerts and was initially developed for optimizing option portfolio risk. +While not predictive directionally, VBS gives as a by-product excellent risk-reward setups for directional plays
VBS Process
- Radar, Alert, Trigger, Entry, Exit
- Radar- VBS generates 2 prices, one above and one below current prices for a "breakout" in market volatility
- Alert- One of the prices is breached and closes its bar/ candle beyond that price level.
- Trigger- Real volatility will expand
- Market direction does not have to continue in the direction the price in #1 was broken
- volatility based risk- reward prices are generated for directional use. I.E. Risk 1 to make 2
- Entry- using the VBS risk/ reward generated levels, a decision is made to either go with the directional trend, against it, or do nothing
- The trigger gives 2 bites at the apple if the trader so desires.
- In "first way, wrong way" scenarios reversal levels are generated (N.B.- our preference is to not play the reversal and have left money on the table in favor of the trauma of being "chopped up". if compelling, we have used options to remain in the game on reversals)
- Exit- is either from a stop-out, a profit capture, or a time limit
- Stop-Loss- are generated by VBS and adhered to religiously. Profitable trades trail stops higher based on expanding volatility
- Profits- exits can be subjective, we prefer taking 90% of position at target and leaving a tail if the VBS is not signalling Vol is overbought
- Time Exit- trades that are neither profitable nor stopped out are exited in 3 bars/ candles. The signal is designed for quick confirmation / rejection of the trigger
Good Luck
About the Author: Vince Lanci has 27 years’ experience trading Commodity Derivatives. Retired from active trading in 2008, Vince now manages personal investments through his Echobay entity. He advises natural resource firms on market risk. He pioneered and executed the Nat Gas EOO arbitrage trade of 2006 to 2008, netting over $90MM for a NYC hedge fund before retiring. Over the years, his expertise and testimony have been requested in energy, precious metals, and derivative fraud cases. Lanci is known for his passion in identifying unfairness in market structure and uneven playing fields. He is a frequent contributor to Zerohedge and Marketslant on such topics. Vince contributes to Bloomberg and Reuters finance articles as well. He continues to lead the Soren K. Group of writers on Marketslant.
Read more by Soren K.Group


