Between now and November 1st may be the decisive time frame of vol getting ready to expand for a long period. Soon thereafter the market will pick which way it wants to go and be unstoppable in all likelihood. That is why straddles are more important than guessing which way on this next alert
Macro Gold Technical Report
via Moor Analytics
Note: this is a professional traders report and is written as such. If you have any questions feel free to ask in comments and we will be happy to explain terms and rationale of the author best we can. Otherwise, we’d recommend contacting Michael directly
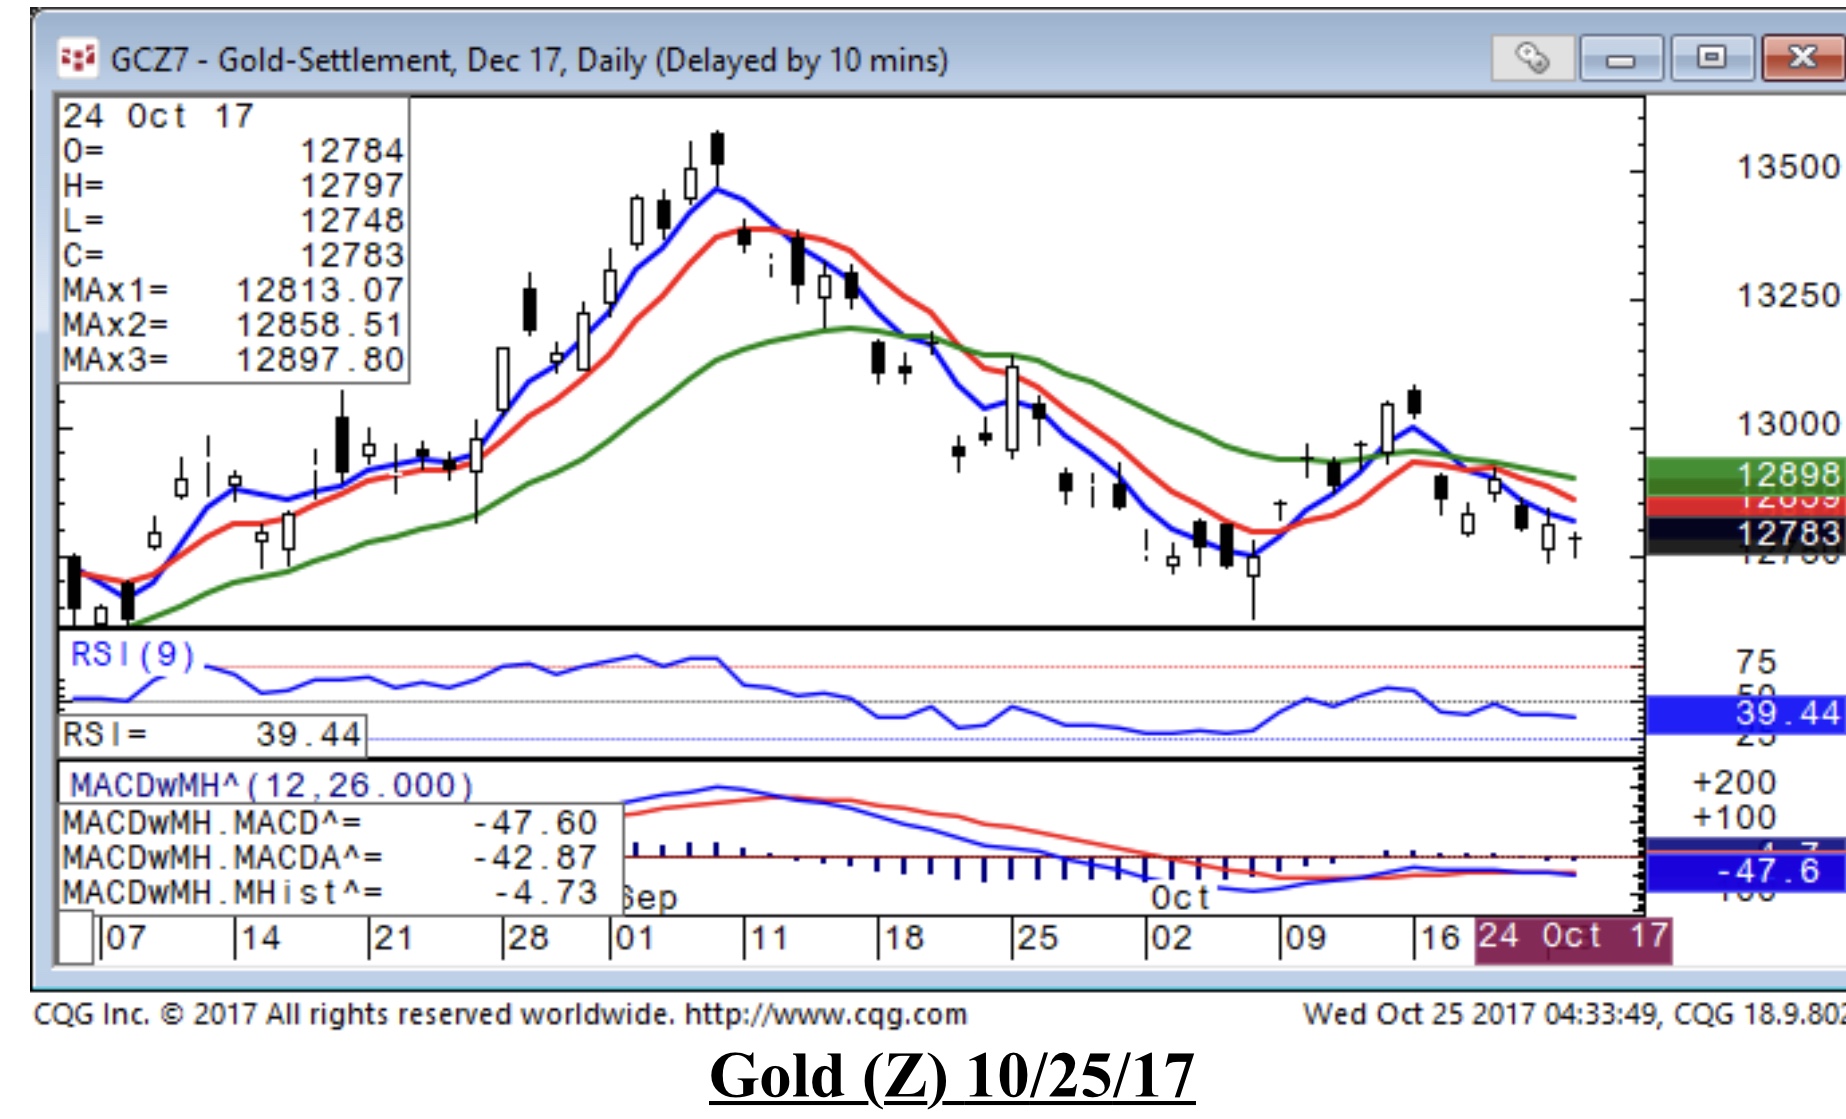
Gold (Z) 10/25/17
On a shorter-term basis: I cautioned that an area of possible exhaustion for this move up from 12628 came in at 13077-81. We have rejected $35.1 from this so far. The maintained gap lower on 10/17 was a bearish signal, and we have seen $13.6 of this from the close. Decent trade below 12759-58 (+.4 of a tic (4 cents) per/hour starting at 8:20am) will project this downward $7.5 minimum, $19 (+) maximum; but if we break below here decently and back above decently, look for decent short covering to come in. Decent trade above 12796 (-1.5 tics (cents) per/hour starting at 8:20am) will project this upward $8.5 minimum, $13 (+) maximum; but if we break above here decently and back below decently, look for decent profit taking to come in.
On a macro basis: There is a macro resistance line coming in at 13500 all week. We were looking for a multi-week smackdown from where it came in the week of 9/11 at 13522, and are seeing some of this as we have come off $89.4 so far. We left a medium term bearish reversal intact above on 9/18 that also warns of continued pressure in the days/weeks ahead. We have seen $48 so far. Within the overall bearishness I noted that a possible area of exhaustion for this move down from 13624 comes in at 12732-644. We basically held this, but with a $1.6 violation, and rallied to 13084 before rolling over. Although 12628 is a support on the way down, it is no longer an exhaustion area (for this approach). Decent trade above 13039 (-.2 of a tic (2 cents) per/hour starting at 8:20am) will project this upward $31 minimum, $49 (+) maximum; but if we break above here decently and back below decently, look for decent profit taking to come in.
END
VBAS Trading Algorithm Levels for Gold
Via SKG Contributors
Notes From a call today on potential gold trades.
- It looks like we will be seeing a move of $50 to $75 in either direction in the next 90 days.
- That move could be slow and orderly, or fits and starts, that is not handicappable or important to the system
- If a move like above occurs, then we will most definitely get a signal to be long Vol. on a risk reward basis as the monthly indicator will expand
- Directionally, our first play would be to go with the direction at time of the trigger. Our second would be to stop and reverse at a predetermined level.
- this is a longer term play than usual for the VBAS so we will most likely express the position traditional way via long straddles.
- Direction would then be expressed by NOT hedging gamma on daily break evens but more like every 2 weeks, and then only half of accumulated deltas. In this way we would remain long/ short in direction of the trend.
Decision levels basis spot:
Daily:
- Long above 1296 on a settlement: with a stop at 1288
- short below 1269 on a settlement or near end of day with a stop at 1278
- profit levels on both are 1.5x amount risked.
- Sell half position at profit levels and then trail stoploss on remaining to entry point.
- Exit in 3 bars if not profitable but not stopped out. Chances of profits diminish greatly if no quick follow through
Weekly:
- Nothing on radar
Monthly:
- Buy straddles or hedged call spreads on a monthly settlement above 1305 or below 1191
- early entry- pit on 1/2 position on a day signal as described above.
- exit everything on 3 bars of mot profitable.
- Gamma hedging TBD.
Risk reward set ups:
Daily is tight and would be worth looking at only if mkt settles on either side of outside bands. Still, even then no alert is guaranteed.. but the path to a widening is much easier going down than up right now. And that would not only trigger a daily vol signal but a monthly one (see last graph)
Question is, buy the selloff or surf it when it happens?
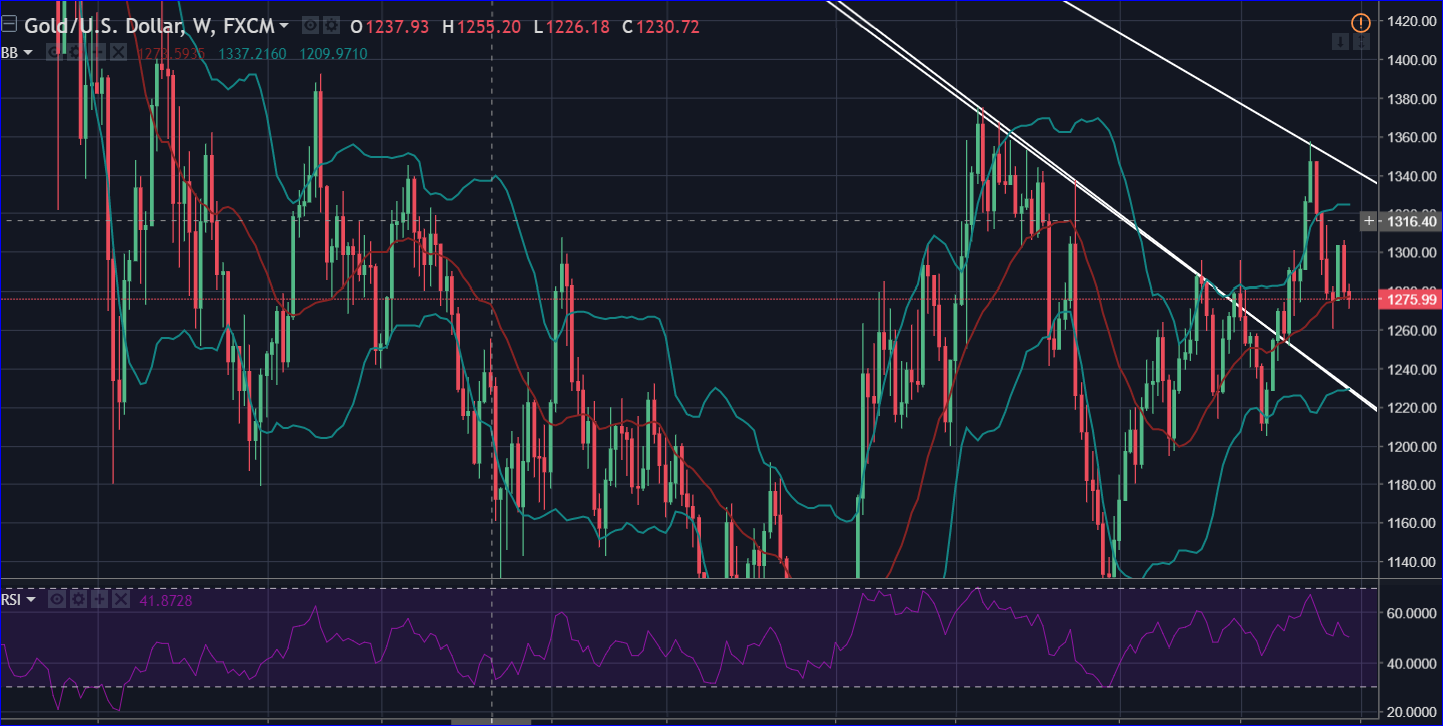
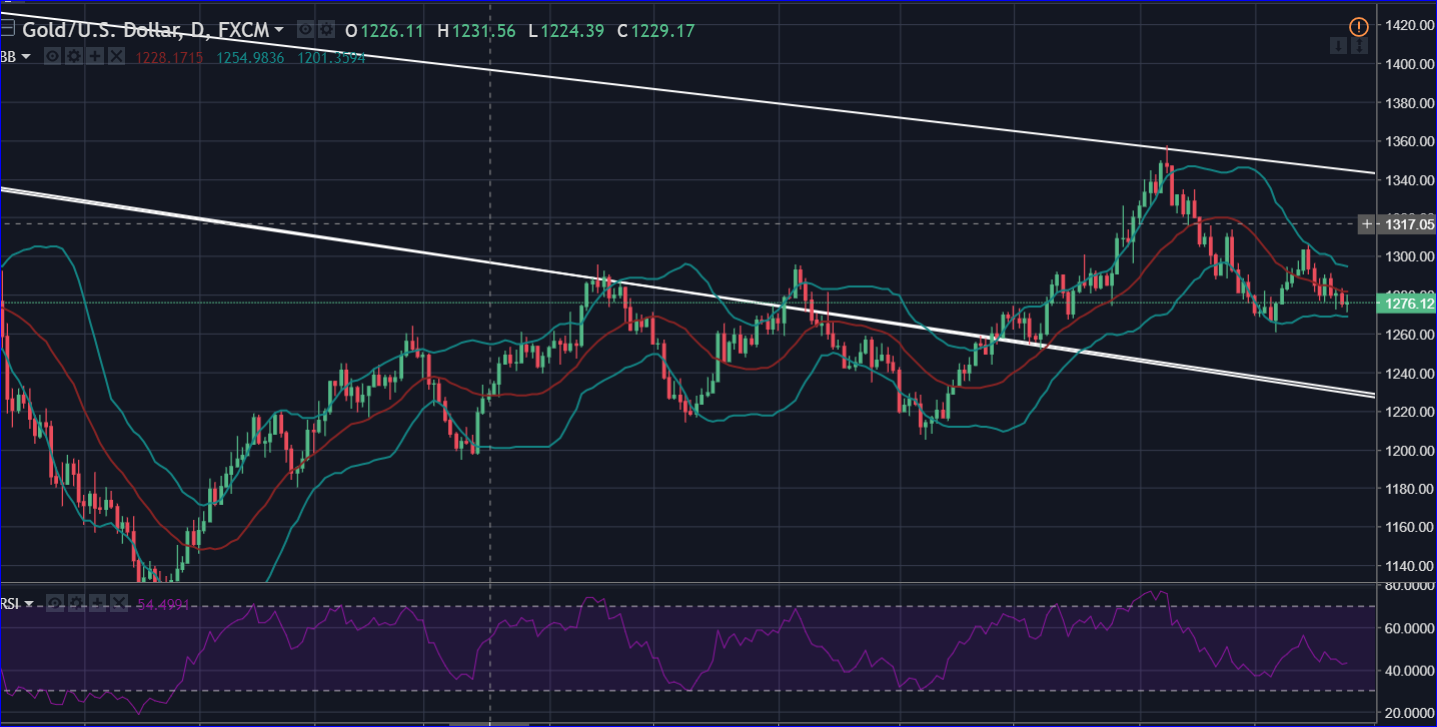 Weekly has already had an exhale and is now inhaling for next cycle.. if it gets a chance
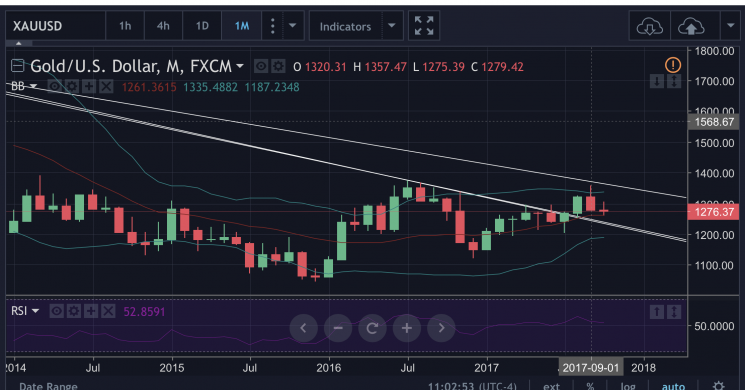
 Monthly is very tight. And what is scary is if this month closes lower than today’s low, even if it is above the bottom line.. we will get a very very rare signal of impending volatility expansion.
Rare because the lines almost never widen in opposite directions unless a boundary is touched. When this does happen it almost always ends in a first way wrong way move the next month.
But it is a very scary rare signal to get while mkt is well inside middle of bands. Basically you would look for 5 bar historical vol to be less than 50% of 20 bar historical vol to do something at all then.
Then you just buy a straddle..
Monthly is very tight. And what is scary is if this month closes lower than today’s low, even if it is above the bottom line.. we will get a very very rare signal of impending volatility expansion.
Rare because the lines almost never widen in opposite directions unless a boundary is touched. When this does happen it almost always ends in a first way wrong way move the next month.
But it is a very scary rare signal to get while mkt is well inside middle of bands. Basically you would look for 5 bar historical vol to be less than 50% of 20 bar historical vol to do something at all then.
Then you just buy a straddle..
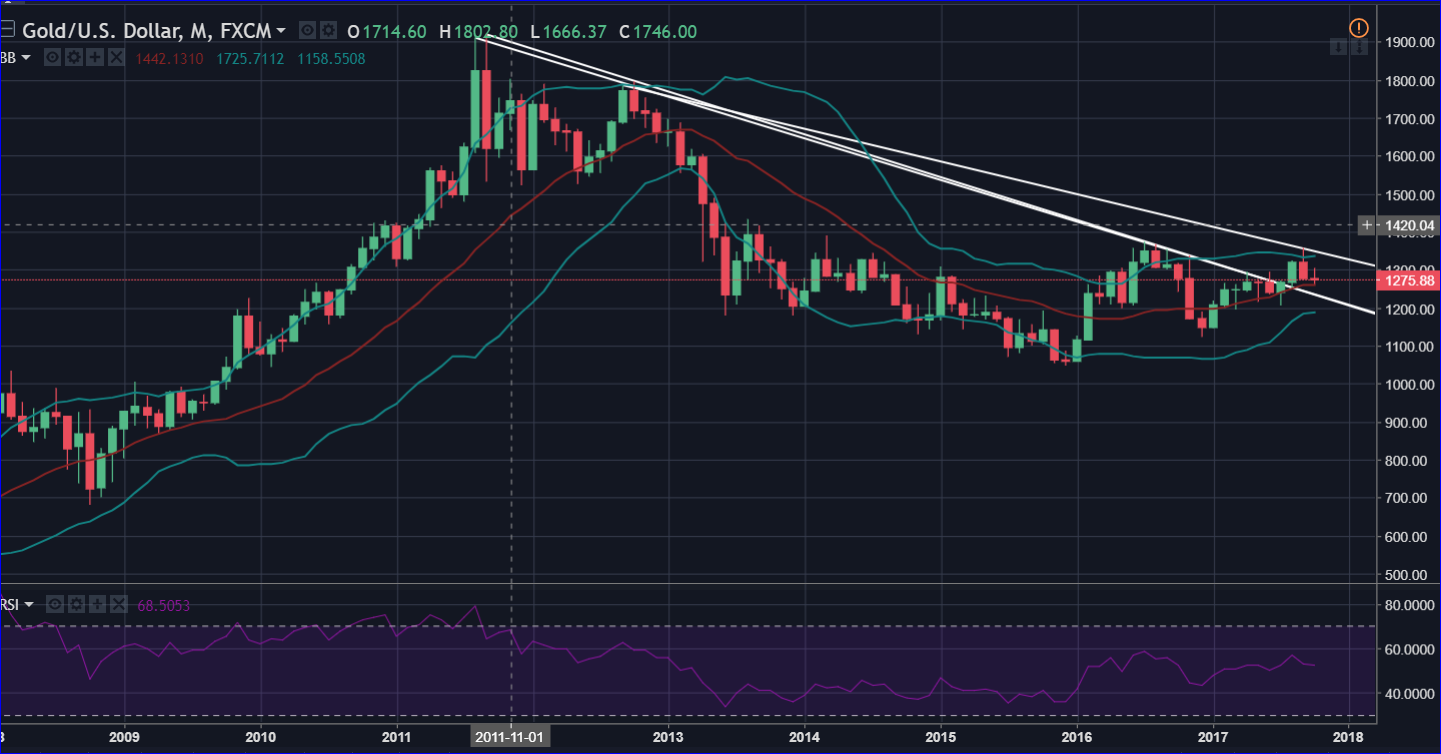 But between now and November 1st may be the decisive time frame of vol getting ready to expand for a long period. Soon thereafter the market will pick which way it wants to go and be unstoppable in all likelihood. That is why straddles are more important than guessing which way on this next alert
Speculatively speaking: bet is false alarm and we tighten even further (market rallies $10) or we shit bed in next week and give a definite “buy vol” signal. But that doesn’t mean we won’t rally hard afterwards.
For more examples and explanations of this system see previous posts: last week, and these two examples:
Read more by Soren K.Group


