Intro: Gold Bull Run to Come?
Yesterday we made the case that Gold has some short term issues and is in danger of a washout. The old adage: “sideways is bearish” comes to mind.
Today we have pierced $1275 on the daily with zero momentum lower thus far. That could mean even the short side algos are packing it in for the year. And in the next 2 hours, if a run to the downside does not happen, then we can take a collective breath here as a storm may pass.
As we write this, gold has found nothing but buying in that area with today’s data as a catalyst to rally a bit. $1275 held, and so now we turn our attention to the upside. Our daily signal likely comes in on a settlement above $1280.
For Enda $1283 in Spot will close out the downside itvseems.
Here then is Enda Glynn again going through his Elliot Wave count. Enda had been spot on in the past when calling the rally from $1250 to $1350 posted here months ago, and that is one of the reasons we like him. The other is the professionalism with which he tweaks Wave counts. Specifically, a good EW person must be objective about their own subjectivity. You read that right. The key to good trading is knowing your bias and keeping it in check to not rationalize bad positions. “Never get emotional about stock” is how Gordon Gekko would say.
Today we see an adjustment on his upside target from the pinnacle of $1550 to an even higher $1827 in his updated count.
We must admit that is hard for even us to swallow,but the math is there when you look at it in context
of our own assessment. We see a $50 move coming in next 90 days, followed by a more massive move in either direction .
The Monthly says a big move is coming in next 60-90 days with no bias as we said in Gold Macro Analysis: A November to Remember
In EW theory, markets regress to the mean,
and the more a rubber band stretches one way,
the more it’s opposite reaction must snap when it reverses. We think that’s the jist here, though we do not process expertise in EW.
Enda is a long term EW analyst and we are short term momentum traders who look at macro for bias.. we cannot dismiss this new wave count. The key is how will Enda account for if gold drops $50 I’m his final target higher?
We’ll let you know if the approaches become irreconcilable . - SKG.
GBPUSD
30 min
4 Hours
Daily

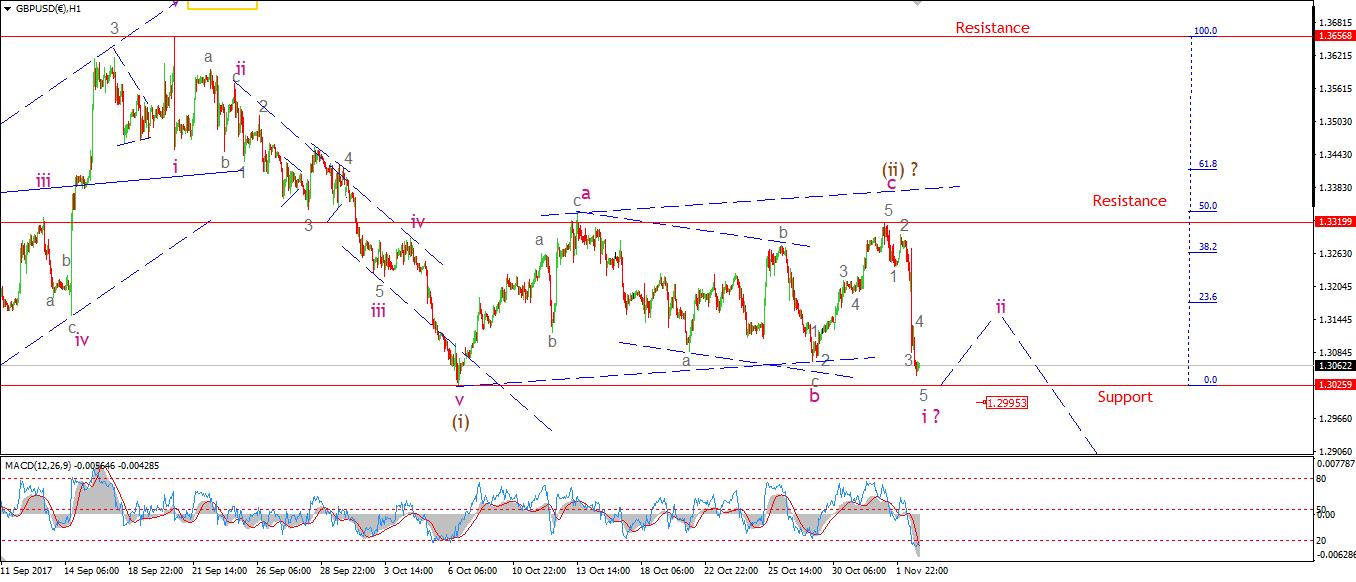
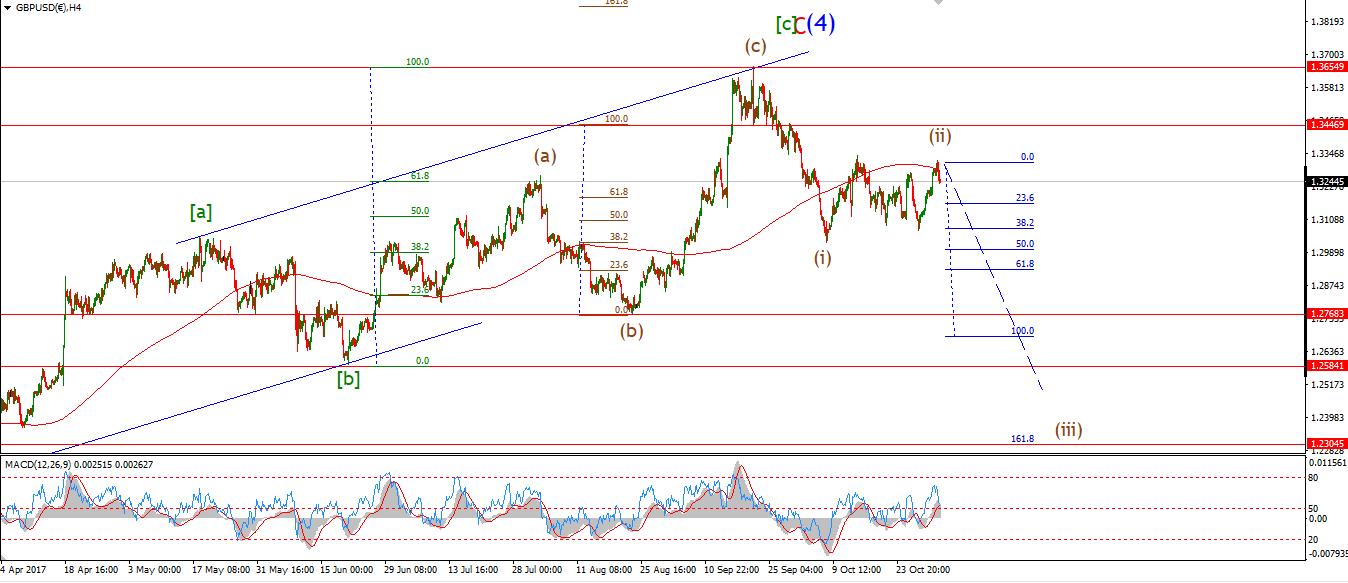
My Bias: short below parity in wave (5). Wave Structure: continuing impulsive structure to the downside in wave (5) Long term wave count: decline in wave (5) blue, below parity
After calling the top in a possible wave (ii) brown Wednesday night at 1.3319. The price tumbled 250 points on Thursday!
The idea of a running flat wave (ii) seems to be confirmed now. And todays sharp decline is the beginning of wave 'iii' of (iii). 1.3319 now becomes key resistance on the short term chart.
The price seems to have traced out a five wave pattern into todays lows, I have labelled this wave 'i' down. A break of support at 1.3025 will add significant weight to the short term wave count.
For next week; Watch for a three wave recovery in a possible wave 'ii' pink.
That should complete another bearish elliott wave signal in cable, the outlook remains solidly negative for now.
USDJPY
30 min
4 Hours
Daily
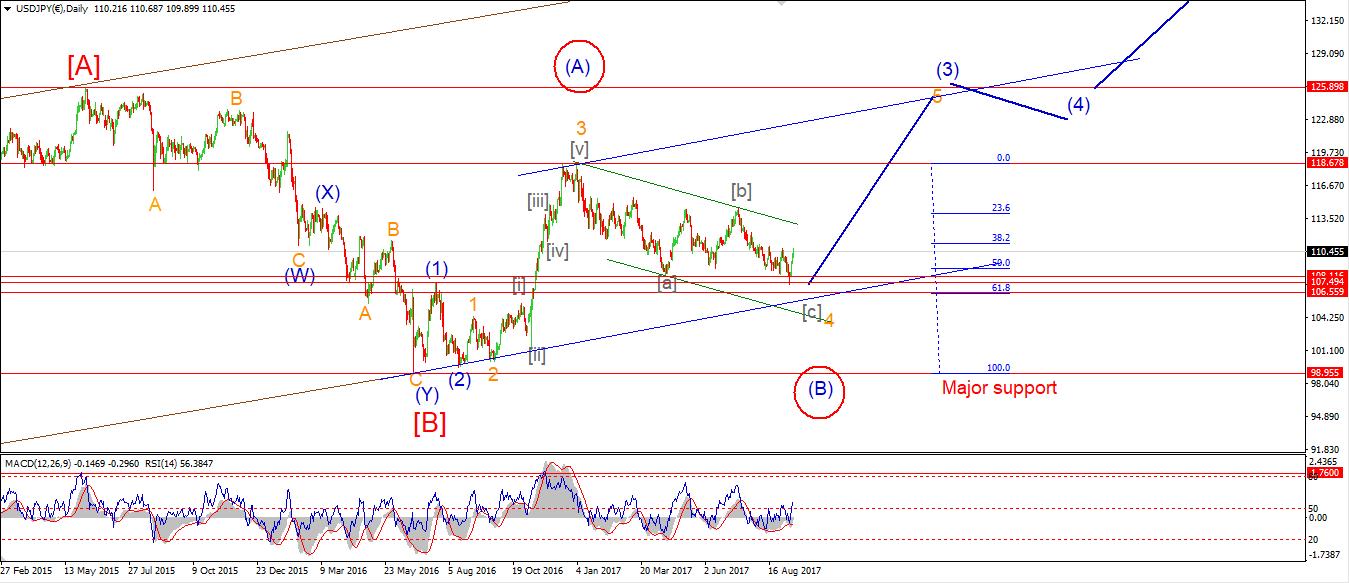
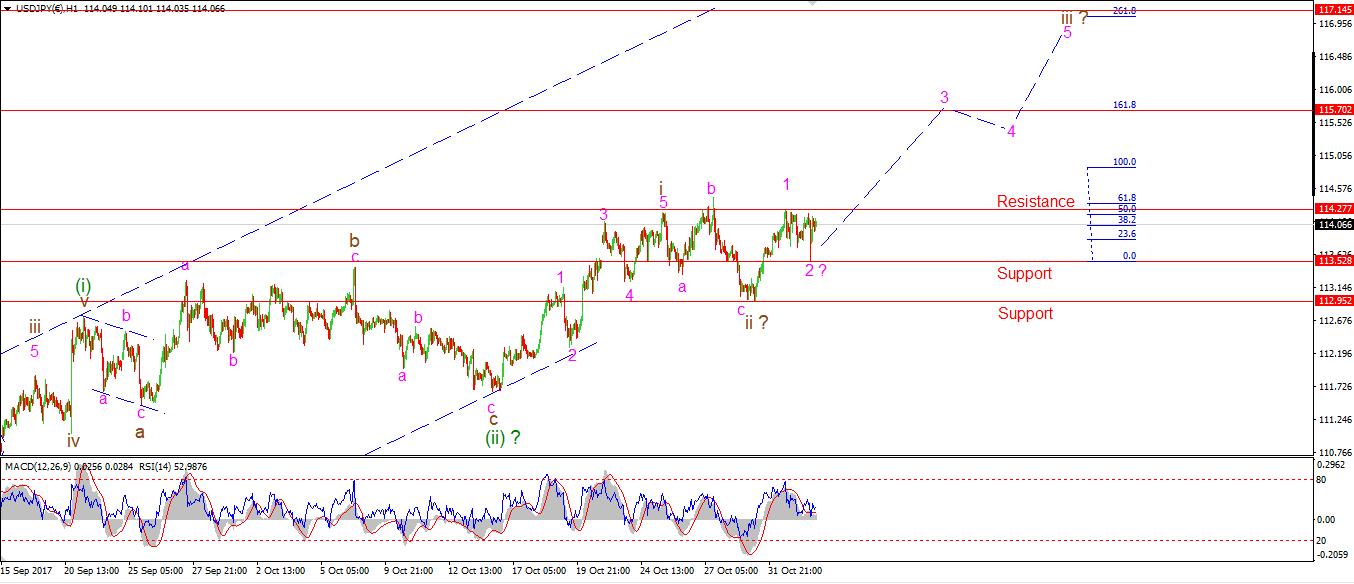
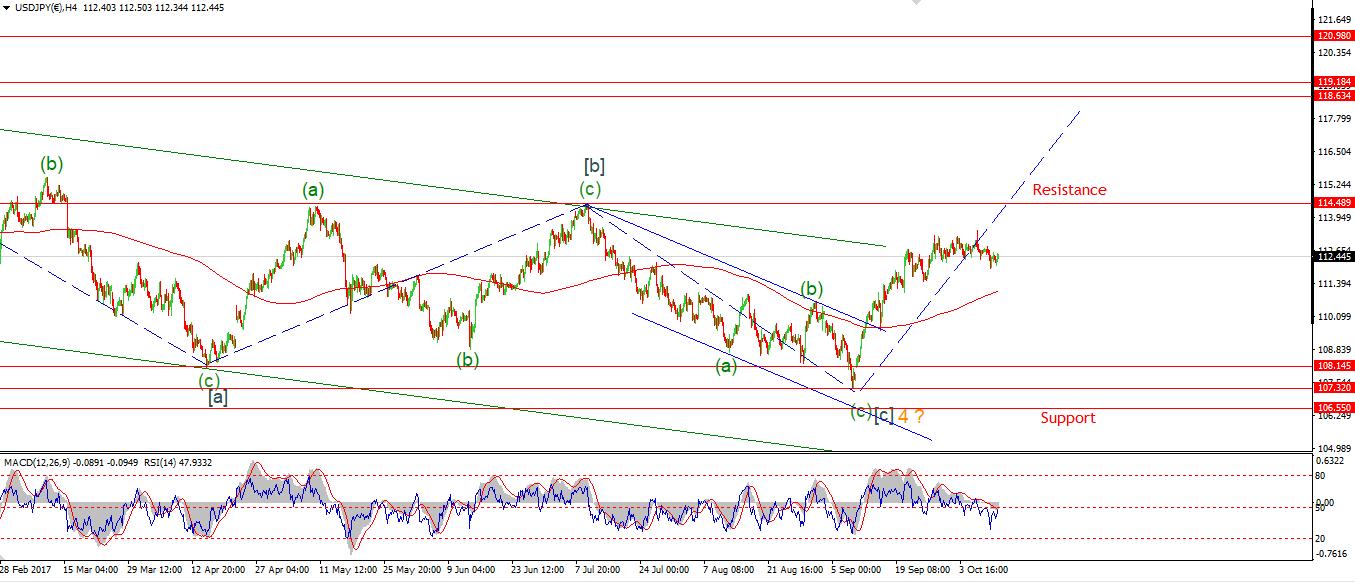
My Bias: LONG Wave Structure: rally in wave [C] Long term wave count: wave [C] is underway, upside to above 136.00
As expected, USDJPY corrected in a wave '2' pink today. The decline was very choppy and made zero net gain so it qualifies as a corrective form.
The price has again bounced higher this evening in a possible wave '3' pink. The Fibonacci projection for wave '3' lies at 115.70, With support at 113.52, a break of the wave '1' high will confirm the beginning of wave '3'.
For tomorrow; 113.52 should hold from here on. 114.27 is the price to watch to confirm wave '3' has begun. The price could rally quickly from here as it is a possible wave '3' of 'iii' of (iii).
GOLD
30 min
4 Hours
Daily
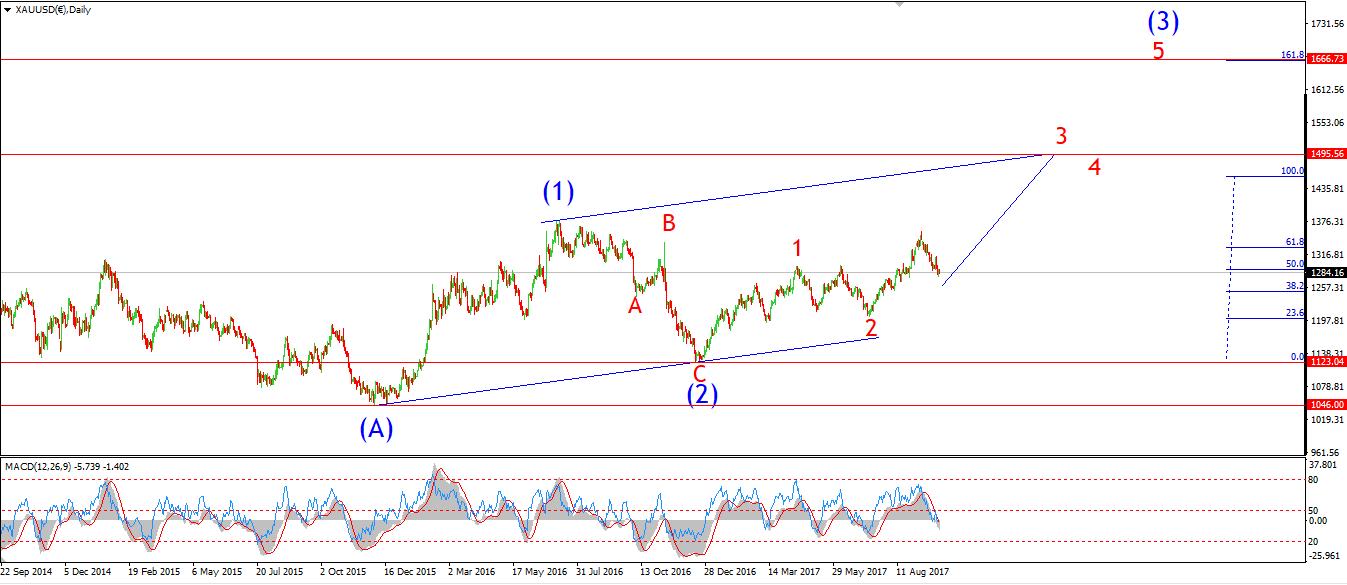
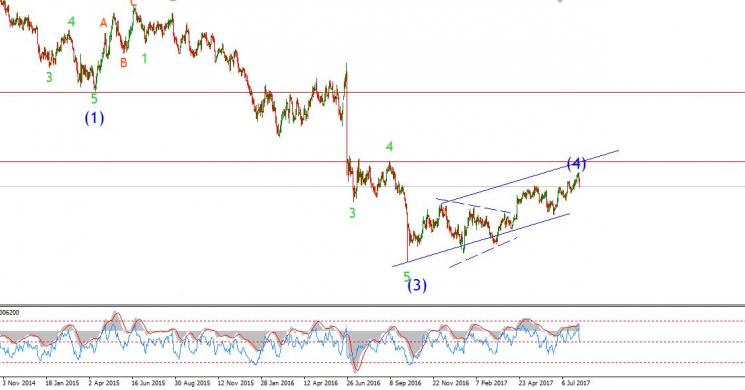
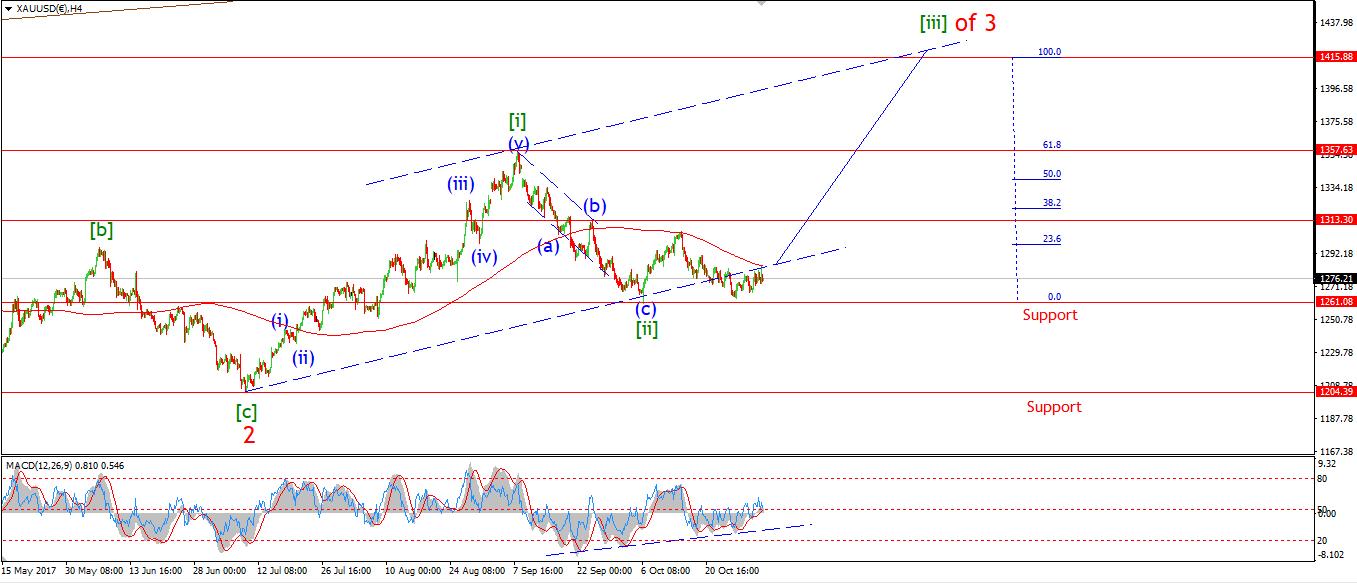
My Bias: Long to a new all time high above 1827. Wave Structure: Impulse structure to a new high. Long term wave count: wave (3) above 1666.
On the 4hr chart the price actually met the 200MA today with that spike in at the U.S open. So we sit at an interesting juncture in the price structure right now. I want to see the price break up through that 200MA and start to use it as support from here. Also on the 4hr chart. The MACD is on the verge of a bullish momentum signal, As it is about to break up above the centreline.
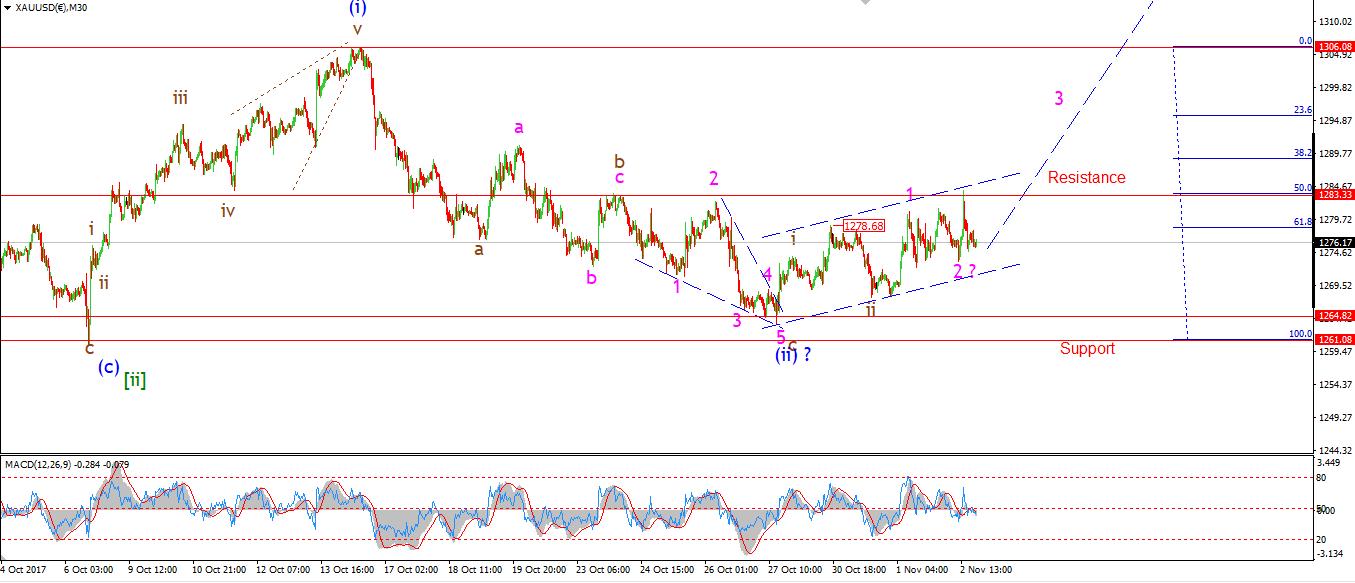
On the short term chart. The spike higher today may be the beginning of wave '3' pink. If that is the case, Then todays low at 1273.96 must hold as wave '3' develops.
For tomorrow, 1283 remains key resistance in the short term. A solid break above that line will be redeem the bullish short term count.
Read more by Enda Glynn


