Quite a bit has changed in the global markets and future expectations over the past 4+ weeks. Q4 2019 ended with a bang. US/China Trade Deal, US signing the USMCA Continental Free Trade Agreement, BREXIT and now the Wuhan Virus. On top of all of that, we’ve learned that Germany and Japan have entered a technical recession. As Q4-2019 earnings continue to push the US stock market higher – what should traders expect going forward in 2020?
Volatility, Sector Rotation, and Continued US Stock Market Strength.
Our researchers have been pouring over our charts and predictive modeling tools to attempt to identify any signs of weakness or major price rotation. There are early warning signs that the US Stock Market may be setting up for a moderate downside price rotation within the first 6 months of 2020, but we believe the continued Capital Shift that has been taking place over the past 24+ months will continue to drive foreign investment into the US and North American stock markets for quite a while in 2020 and 2021.
The interesting component to all of this, which should keep investor’s attention and really get them excited, is the chance that some type of foreign market disruption may take place in 2020 and 2021. There are a number of things that could potentially disrupt foreign market expectations.
First on the list is this virus event in China (that seems to be spreading rapidly). Second would be the news that Japan and Germany have entered a recession. Further down the list is the very real possibility that many Asian and foreign nations could see a dramatic decrease in GDP and economic activity throughout much of 2020 and 2021.
It is far too early to make any real predictions, but traders need to be aware of the longer-term consequences of global markets entering a contraction phase related to a confluence of events that prompts central bank intervention while consumers, financial sectors and manufacturing and industrial sectors are pummeled. Imagine what the global markets would look like if 25% to 55% of Asia, Europe, and Africa see a dramatic decrease in economic output, GDP and financial sector activities (on top of the potential for massive loan defaults). It may spark another Credit Crisis Event – this time throughout the Emerging and Foreign markets.
A massive surge in US stock market valuation has taken place since the start of 2020. It is very likely that foreign capital poured into the US stock market expecting continued price advancement and very strong earnings from Q4 2019. This valuation appreciation really started to take place in early 2019 and continued throughout the past 14+ months. We believe this valuation appreciation is foreign capital dumping into the US markets to chasing the strong US economic expectations.
We believe this surge into the US stock markets will continue until something changes future expectations. The US Presidential election cycle would usually be enough to cause some sideways trading in the US stock market – maybe not this time.
The fact that Japan and Germany, as well as China very soon, have entered an economic recession would usually be enough to cause some sideways price rotation in the US stock market – maybe not this time. The potential wide-spread economic contraction related to the Wuhan virus would normally be enough to cause some contraction or sideways trading in the US stock market – maybe not this time.
There is still a risk that price could revert to middle or lower price channel levels at any time in the future. We’ve highlighted these levels on the charts below. Yet, we have to caution traders that the foreign markets may be setting up for one of the largest capital shift events in recent history. If any of these contagion events roil the foreign markets while the US economic activity and data continue to perform well, then we could be setting up for a massive shift away from risky foreign markets/emerging markets and watch global capital pour into Safe-Havens (metals/miners) and pour into the US stock market (US, Canada, Mexico).
We’ve authored numerous articles about how the foreign markets gorged themselves on debt after 2009 while easy money policies allowed them to borrow US dollars very cheaply. We’ve highlighted how this debt is now hanging over these corporations, manufacturers and investors heads as a liability. The recent REPO market activity suggests liquidity risks already exist in the global markets. If these liquidity issues extend further, we could see a much broader market rotation within the US and foreign markets.
DOW JONES INDUSTRIAL AVERAGE – QUARTERLY CHART
Currently, the US stock market appears to be near the upper range of a defined price channel. Near these levels, it is not uncommon to see some downside price rotation to set up a new price advance within the price channels. This INDU chart highlights the extended price channel trend, originating from 2008, and the more recent price channel (yellow) originating from 2015. Any breakdown of these channels could prompt a much broader downside price move.

S&P 500 – QUARTERLY CHART
This SPY chart highlights the extended upside price trend in the US stock markets. The SPY has recently breached the upper price channel level. It may be setting up a new faster price channel, yet we believe this rally in early Q1 2020 is more of a reaction to the very strong 2019 US economic data and the continued capital shift pouring capital into the US markets. A correction from these levels to near $275 would not be out of the question.

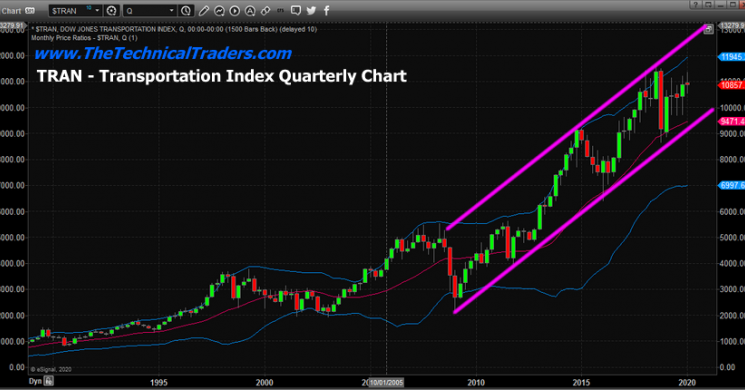
TRANSPORTATION SECTOR – QUARTERLY CHART
This Transportation Index (TRAN) chart presents a very clear price channel and shows a moderate weakness recently in this sector. The fact that the TRAN has consolidated into a middle range of the price channel while the other US stock market indexes continue to push higher suggests the valuation advance in the US stock market is mostly “capital chasing strength of the US economy” than a true economic expansion event.

2020 will likely continue to see more volatility, more price rotation, more US stock market strength and further risks of a reversion event. We believe forward guidance for Q1 and Q2 will be revised lower as a result of these new global economic conditions originating from Asia, Europe, and Japan.
If the virus event spreads into Africa and the Middle East (think Belt-Road), then we could see a much broader correction event. In the meantime, prepare for weaker future earnings related to the shut down of industry and consumer sectors throughout much of Asia.
If this “shut down” type of quarantining process extends throughout other areas of the world, then we need to start to expect a much broader economic contraction event. Minor events can be absorbed by the broader markets. Major events where global economies contract for many months or quarters can present a very dangerous event for investors.
Overall, we may see another 20 to 40+ days of “sliding higher” in the US stock market before we see any real risks become present for investors. This means you should start preparing for any potential unknowns right now. Plan accordingly as this event will likely result in a sudden and potentially violent change in price trend.
Join my Swing Trading ETF Wealth Building Newsletter if you like what you read here and ride my coattails as I navigate these financial markets and build wealth while others lose nearly everything they own.
Chris Vermeulen www.TheTechnicalTraders.com

NOTICE: Our free research does not constitute a trade recommendation or solicitation for our readers to take any action regarding this research. It is provided for educational purposes only. Our research team produces these research articles to share information with our followers/readers in an effort to try to keep you well informed. Visit our web site (www.thetechnicaltraders.com) to learn how to take advantage of our members-only research and trading signals.


