The Yen and Gold Tied at the Hip
The Yen and Gold have been highly positively correlated as safe haven assets over the last several years. As investors play the risk-off game, they collectively buy the USD, US Treasuries, Gold and the JPY. International crises both financial as in BREXIT, and military that occur far from US shores cause the greenback and Gold move higher in tandem. The exception to this is when the crisis is US based; with debt ceiling worries being a financial example and our own potential involvement in a geo-political crisis (Russia, North Korea?) being the military example. in cases where Gold adn the USD rally the Yen usually benefits doubly.
In the run of the mill weekly "normal" risk-off situations we see the USD weaken vs the Yen, while Gold, and UST rally. Yen buyers avoiding risk are likely more eastern based and hedging some Chinese economic worries. So the result is both the Yen and Gold rally globally, and domestically we see a rotation out of stocks into UST for a bit.
For example, on Aug 23rd, just yesterday, both Gold and the yen benefited as comments from President Donald Trump on NAFTA and his threat to shut the government over the border wall, provoked another bout of investor caution. This all in advance of the Jackson Hole conference. We think that was a final nudge for investors to flatten out risks going into any jawboning surprises in J-Hole.
This chart gives a good idea both how well the Yen Gold relationship stands both directionally and tightness in correlation. Note a 14% move i n theYen gives a 17% move in Gold, even though in the chart below, the USD moved only 3%. When the EURO is quiet, the Yen drives Gold more than one would think.

Enda Glynn, our go to person in Elliot Wave, has been particularly hot in calling larger trends, especially in Gold and Cable. When Enda says he is BULLISH on the Yen he is saying it will take more Yen to buy a USD. So notionally its price goes up, but it means the Yen's buying power weakens. A Yen that rallies against the USD is in fact weakening. if a reader inverted the relationship from Yen per USD to USD per Yen it would be more intuitive for Gold people. Just know that Enda is saying he is bullish on the USD vs the Yen right now.
Given the strong positive correlation between the Gold JPY as a currency pair, Gold people should pay close attention. Absent a move in the EURO lower vs the USD, the Yen will have its way with Gold in the days ahead.
Soren K. Group
USDJPY
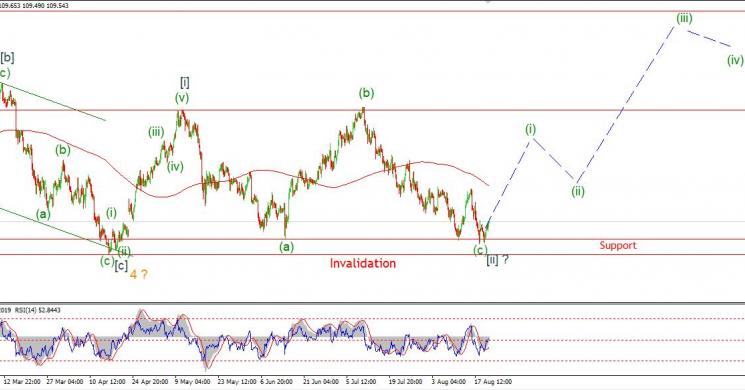
My Bias: LONG Wave Structure: rally in wave [C] Long term wave count: wave [C] is underway, upside to above 136.00 Important risk events: JPY: N/A. USD: New Home Sales, Crude Oil Inventories.
So far the rise off support at 108.60 has been in three waves. The price structure sits just above major support at 107.50, if this market is going to turn up, Which I think it will, It has simply got to happen this week.
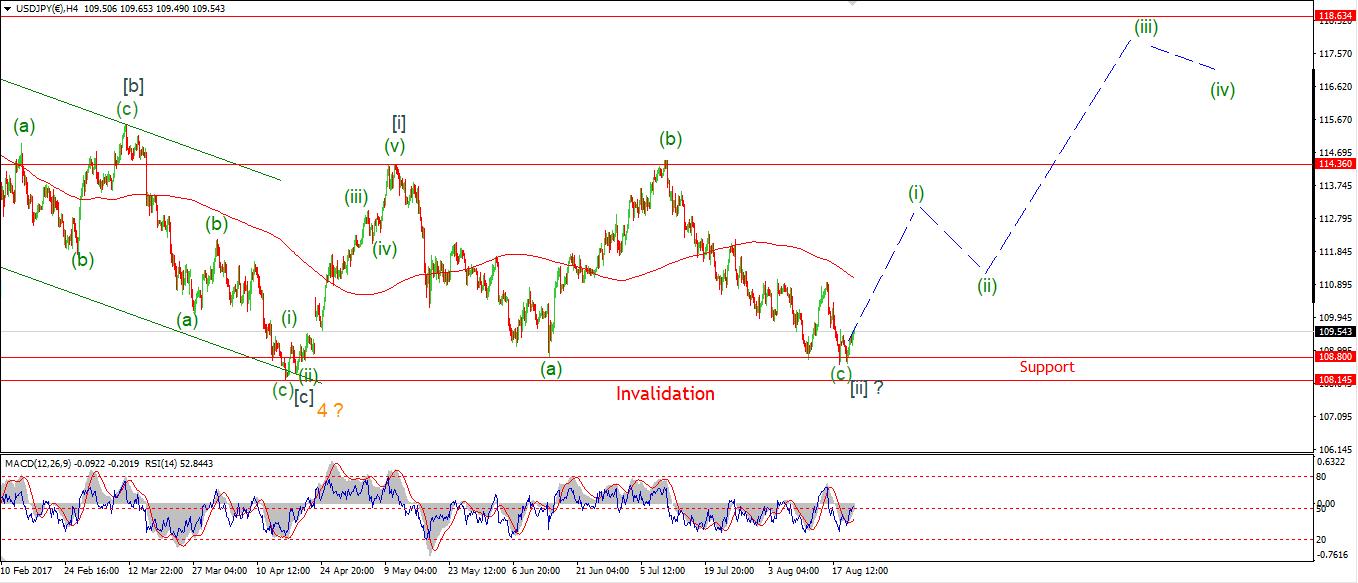
There is a clear bullish momentum divergence on the 4hr chart. With a double bottom in place in RSI. The price has spent the last 6 weeks in decline, even though the larger wave form is still very bullish on the daily chart.
I get the feeling that this market is storing up a very large recoil rally, Which could take the price above 118.60 in wave [iii] grey, If this wave count proves correct.
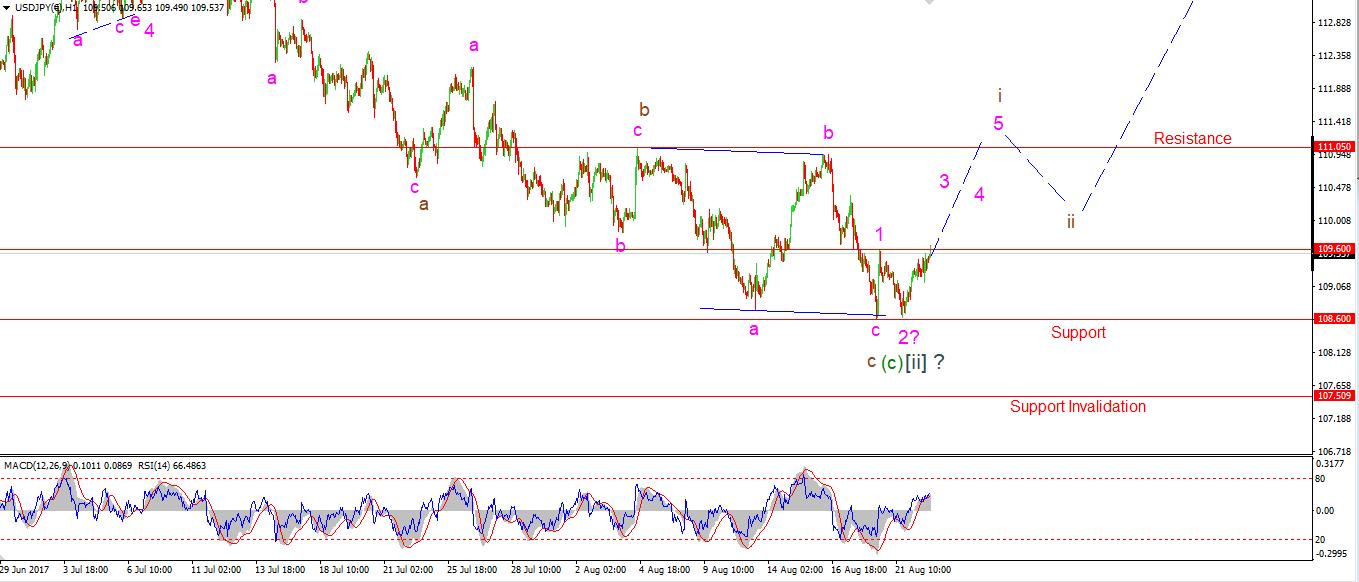
For the next few days it is touch and go for the bullish setup. But if there is a positive move into 111.05 followed by a corrective decline, This will be the setup I have been waiting for. 108.60 must hold.
30 min
4 Hours
Daily

My Bias: LONG Wave Structure: rally in wave [C] Long term wave count: wave [C] is underway, upside to above 136.00 Important risk events: JPY: N/A. USD: New Home Sales, Crude Oil Inventories.
So far the rise off support at 108.60 has been in three waves. The price structure sits just above major support at 107.50, if this market is going to turn up, Which I think it will, It has simply got to happen this week.
There is a clear bullish momentum divergence on the 4hr chart. With a double bottom in place in RSI. The price has spent the last 6 weeks in decline, even though the larger wave form is still very bullish on the daily chart.
I get the feeling that this market is storing up a very large recoil rally, Which could take the price above 118.60 in wave [iii] grey, If this wave count proves correct.
For the next few days it is touch and go for the bullish setup. But if there is a positive move into 111.05 followed by a corrective decline, This will be the setup I have been waiting for. 108.60 must hold.
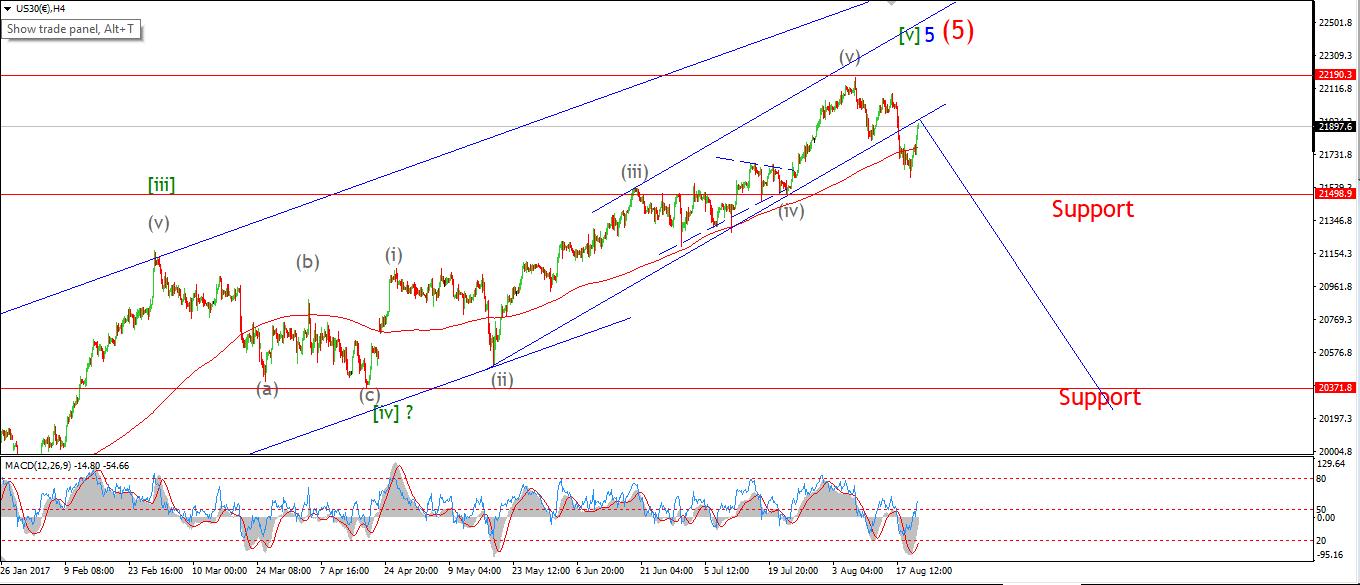
DOW JONES INDUSTRIALS
30 min
4 Hours
Daily

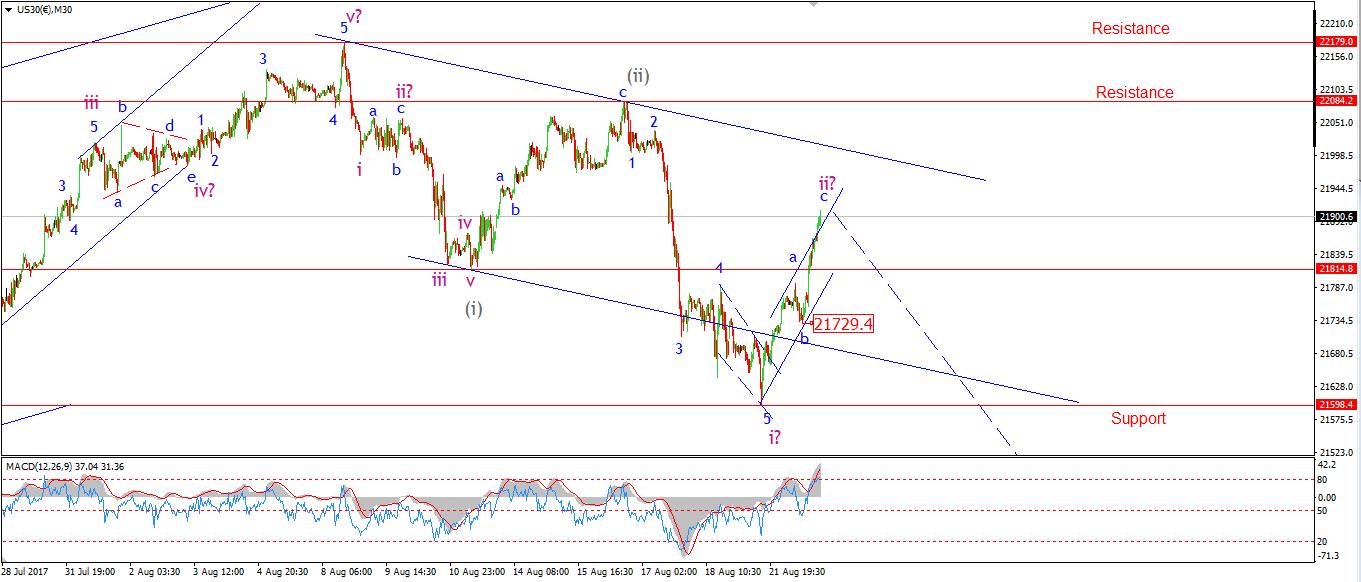
My Bias: market topping process ongoing Wave Structure: Impulsive 5 wave structure, possibly topping in an all time high. Long term wave count: Topping in wave (5) Important risk events: USD: New Home Sales, Crude Oil Inventories.
The declines off the recent all time highs have so far traced out a three wave form. Which does point to a corrective decline.
But, The rally of the recent low is best counted as a three wave move, Which again points to a corrective rise in wave 'ii' pink. So; The bearish wave count is still a very real probability from here.
On the 4hr chart, Last weeks declines punched down through the 200MA, Which is a general bearish warning sign. and since then, The price has rebounded into the large rising trend channel, which should offer resistance.
The daily RSI has now given a momentum sell signal after a showing major divergence form the price for most of the year, with successive lower highs.
At this point, We have a bearish setup in Elliott waves, Momentum signals, and price action. So this could get ugly.
For tomorrow; Watch for signs turn down from todays highs in wave 'iii' pink. A drop below wave 'b' will be the initial sign of a turn down. 22084 is the bearish invalidation line.
Read more by Enda Glynn


