As Elliott Wave amateurs, we appreciate the work done by our anonymous friend below. it is thorough and minimizes subjectivity while acknowledging bias. These are hallmarks of a good analyst in our opinion. Further, the combination with traditional technical analysis is welcome. We hope to see more from the author. - SKG
Originally titled:
Trend lines met, technical's are set - Dollar is ready to rally
EURUSD
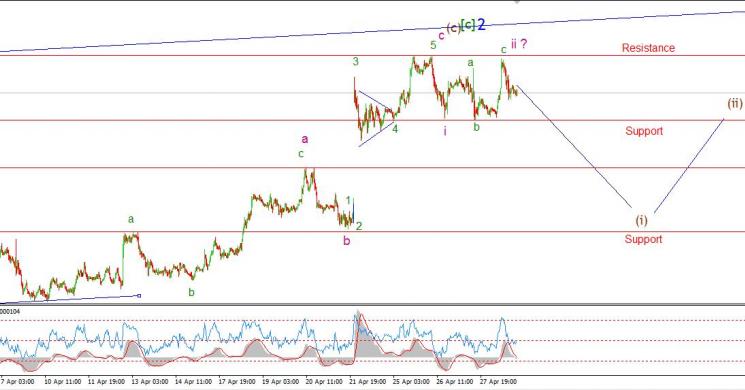
30 min
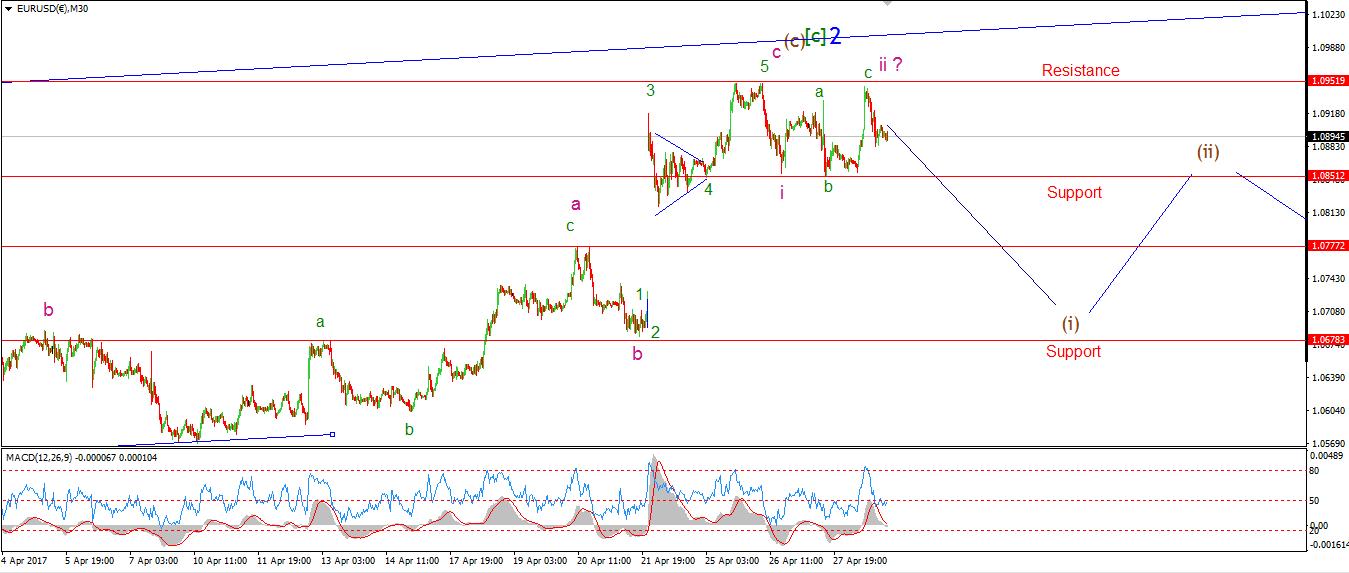
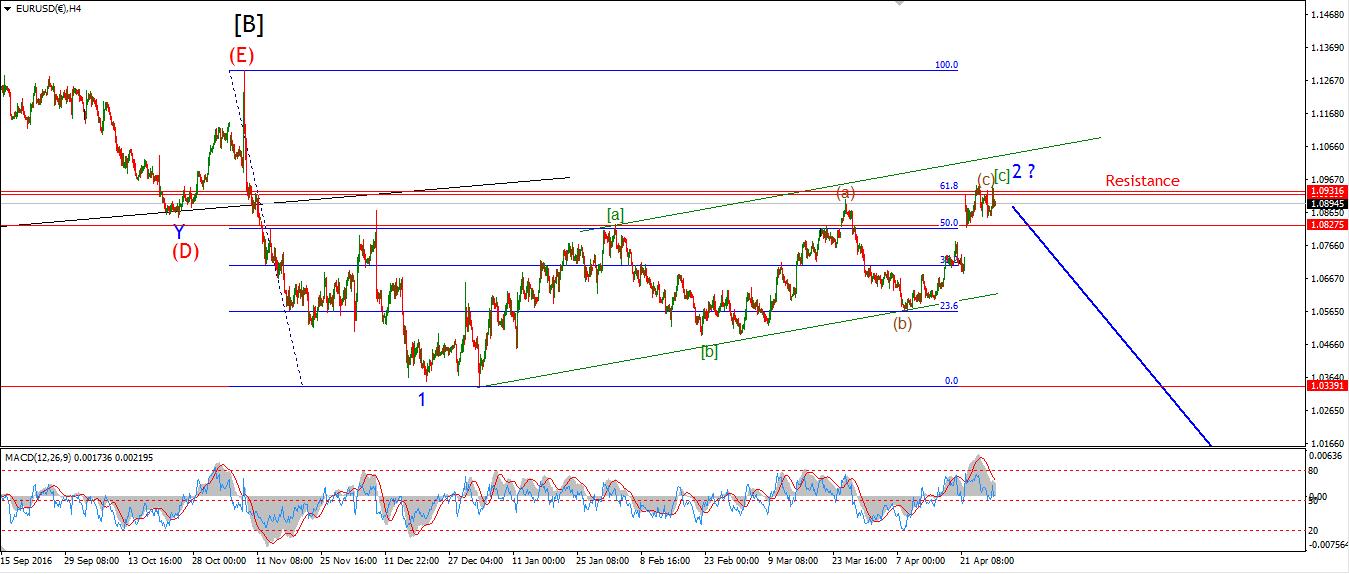
4 Hours
Daily
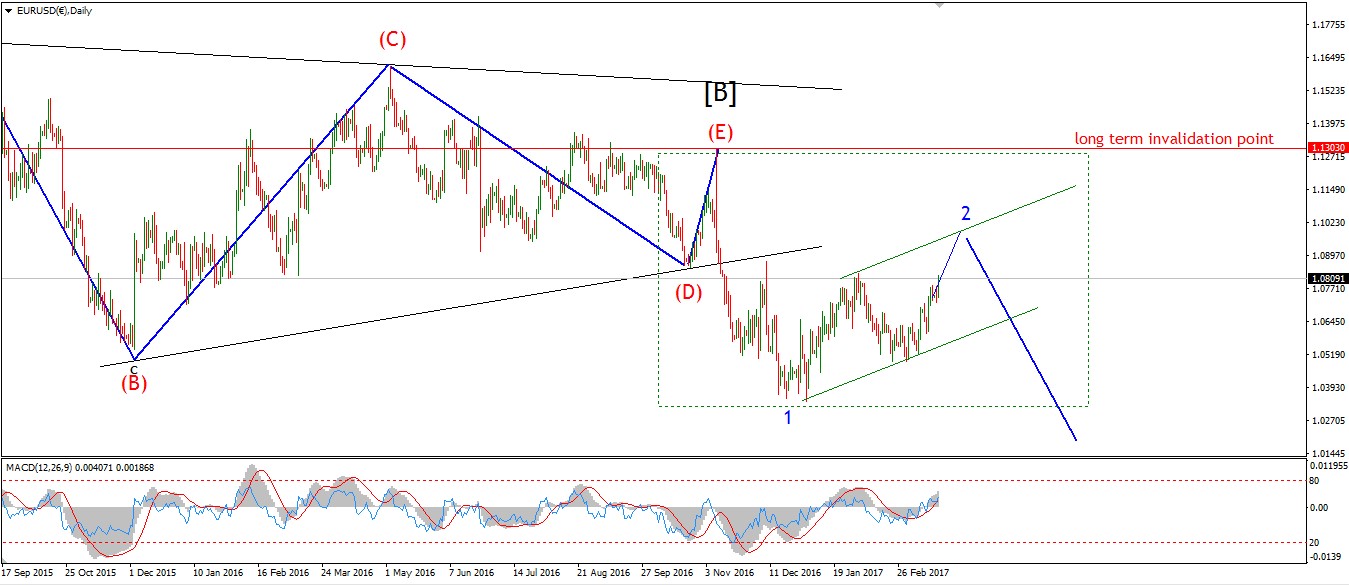
My Bias: short in wave 3 blue. Wave Structure: downward impulse wave 1, 2 blue Long term wave count: lower in wave 3 blue Important risk events: EUR: EU Economic Forecasts. USD: Treasury Sec Mnuchin Speaks, Personal Spending m/m, ISM Manufacturing PMI.
Buenas noches!
We have reached another Friday in one piece. and another day of price candles, each one offers some clue to the future action we can expect. Lets dig in shall we.
EURUSD had a pump and dump day really! I have labeled the rally as wave 'c' green which completes the larger wave 'ii' pink. The price dropped away for resistance at the high this afternoon keeping the bearish setup in play.
Should the price decline below 1.0850, the wave 'i' low, it will signal the top at wave '2' blue is infact in. The outlook from here is for a very large decline in wave '3' blue with a target well below parity. But one step at a time. For monday, watch the initial support at 1.0850, wave 'iii' pink will fill that gap in the price pretty quickly. The price should not break the high at 1.0951 for the short term bearish outlook to remain valid.
GBPUSD
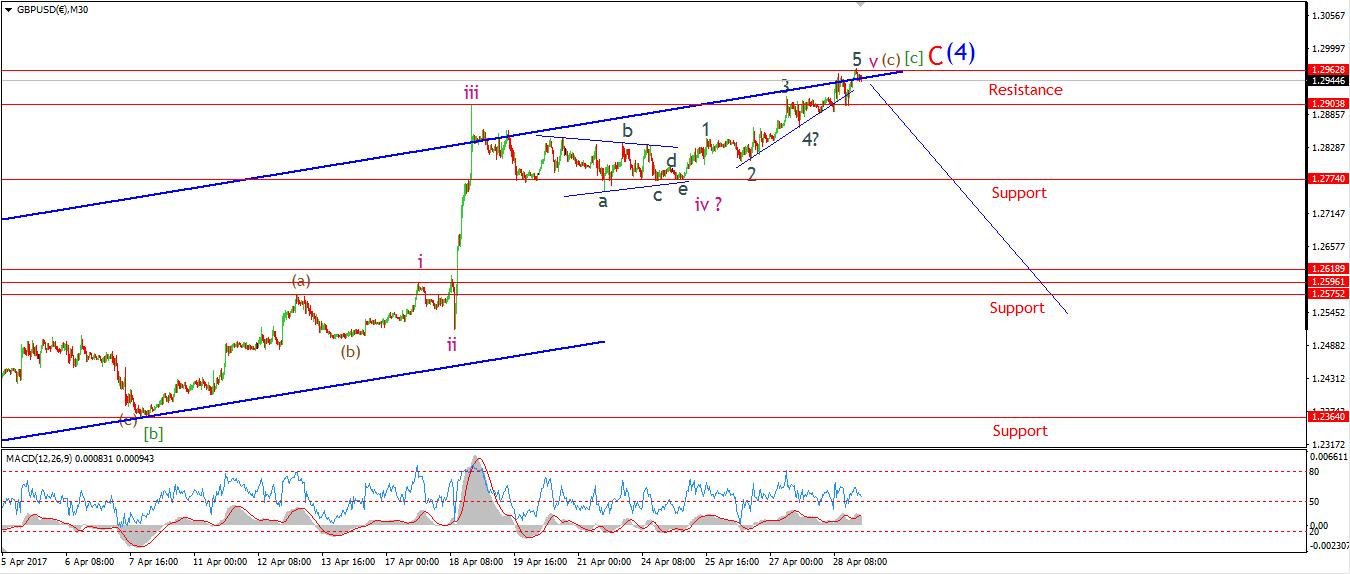
30 min
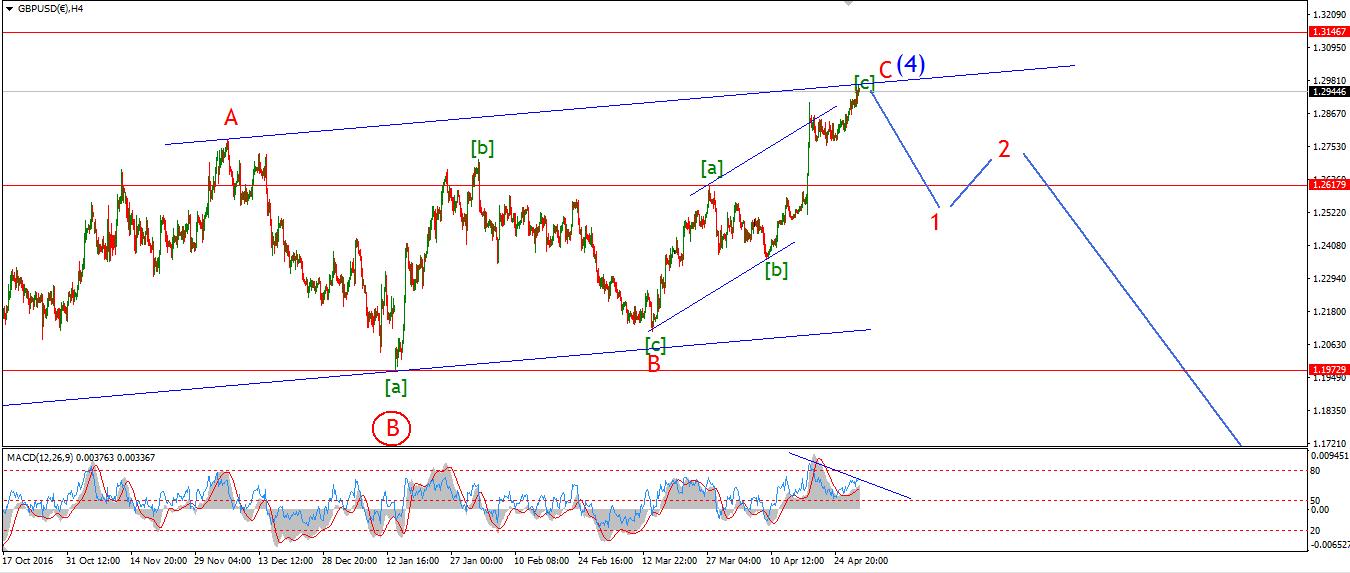
4 Hours
Daily

My Bias: short below parity. Wave Structure: continuing impulsive structure to the downside in wave (5) Long term wave count: decline in wave (5) blue, below parity Important risk events: GBP: N/A. USD: Treasury Sec Mnuchin Speaks, Personal Spending m/m, ISM Manufacturing PMI.
Cable fulfilled the short term target I had set last early on in the week. The upper trendline has been met, and the larger wave pattern looks complete at wave (4) blue. The time has come to look for signals of a turn to the downside to begin wave (5) blue. Initial support at 1.2774 is the first line of defense! If that support gives way in an impulsive looking wave form, and we get a corrective rally to form a lower high. Then we are on for a serious decline in the price. The 4hr chart now shows a serious divergence between the rising price and the declining momentum, A centerline cross to the downside is on the cards for early next week which will add to the bearish signals on display in the wave structure.
For early next week, watch for the formation of a head and shoulders pattern off a nearby high. That should get the ball rolling to the downside.
USDJPY
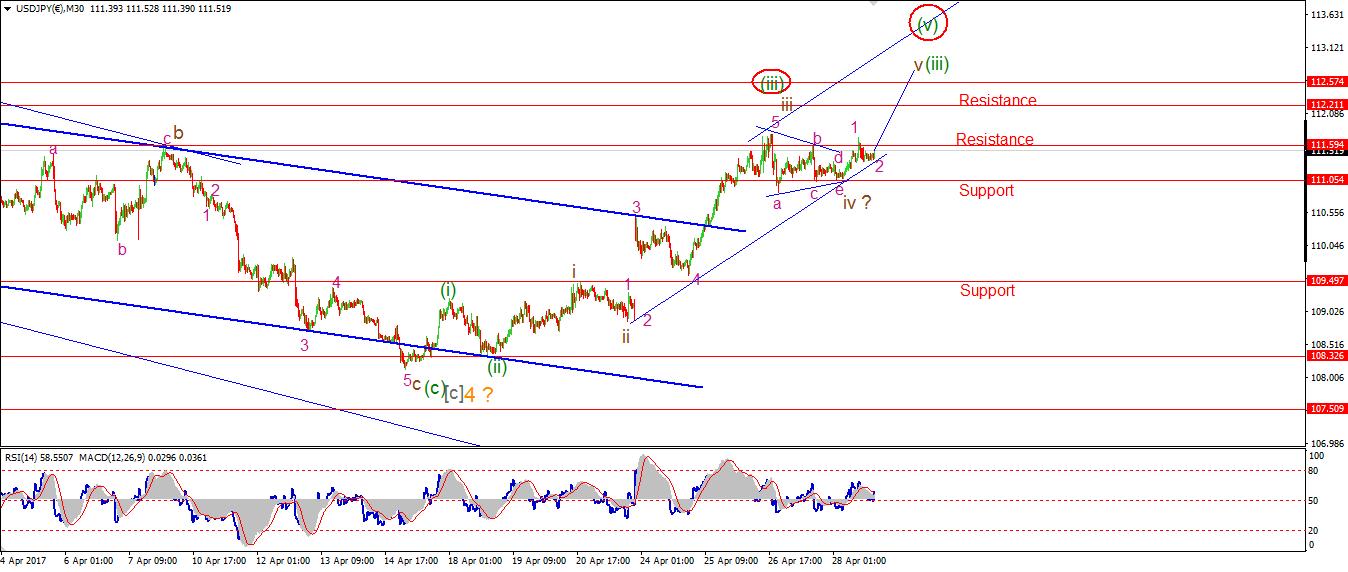
30 min
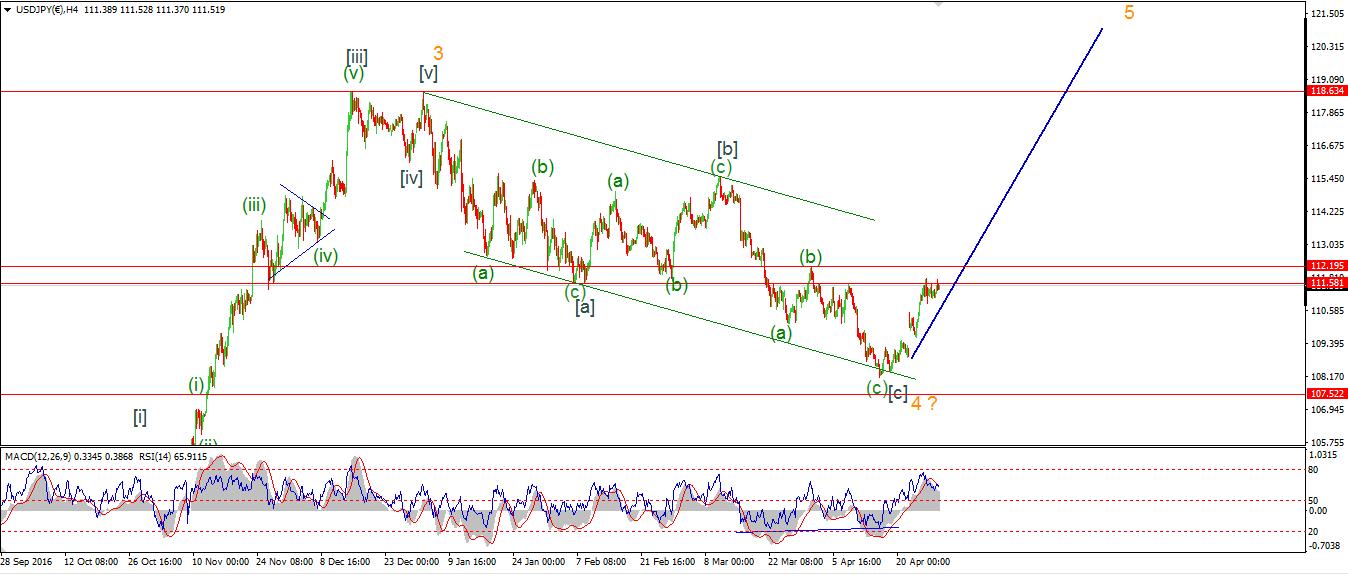
4 Hours
Daily
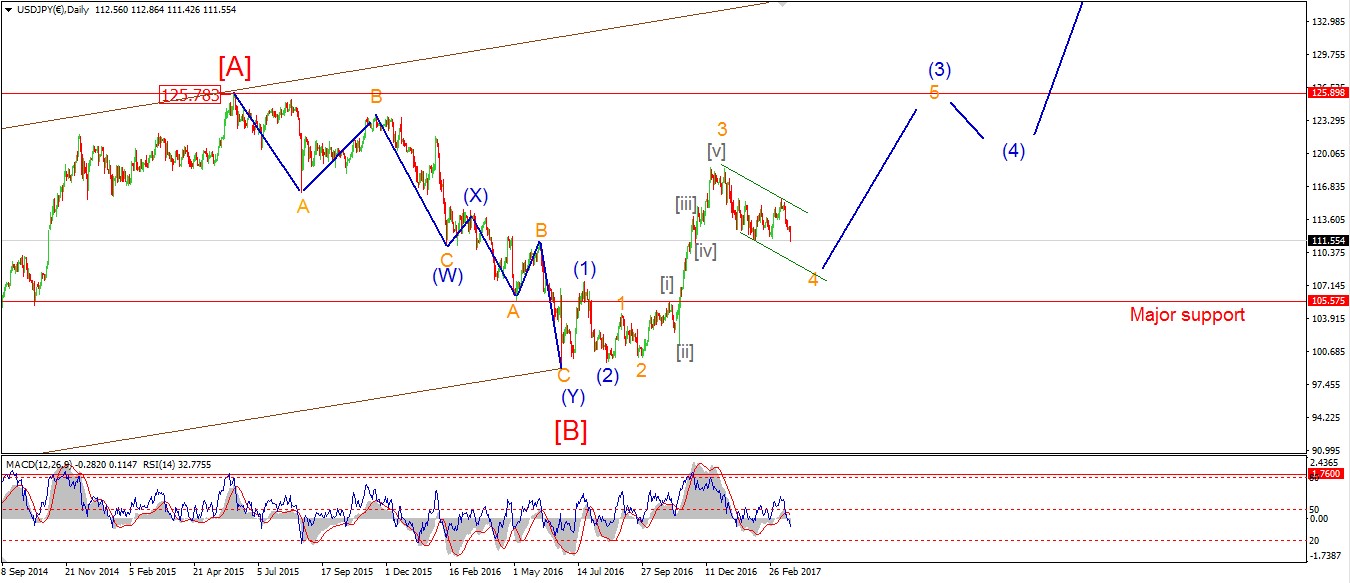
My Bias: LONG Wave Structure: rally in wave [C] Long term wave count: wave [C] is underway, upside to above 136.00 Important risk events: JPY: N/A. USD: Treasury Sec Mnuchin Speaks, Personal Spending m/m, ISM Manufacturing PMI.
Price has now recovered out of the end of the contracting triangle in wave 'iv', and the rise today is likely the beginning of wave 'v' brown. The upper target for wave 'v' brown is at about 112.50, where wave 'i' brown will equal wave 'v' in points travelled.
The price is meeting resistance at 111.59 as expected, But once broken this level will become a major support to the rally ahead.
Given the larger price pattern at play in the 4hr chart, the minimum target for wave '5' orange is above the recent high of 118.66 So the bullish potential is very large here in the long run. For early next week, the wave 'iv' low at 111.07 should hold, and wave 'v' should complete above 112.50.
DOW JONES INDUSTRIALS
30 min
4 Hours
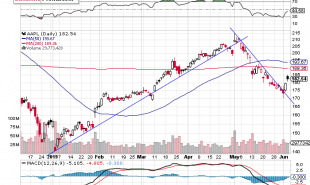
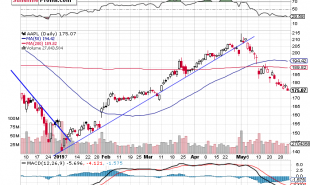
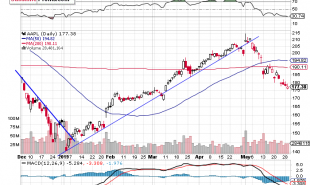
Daily

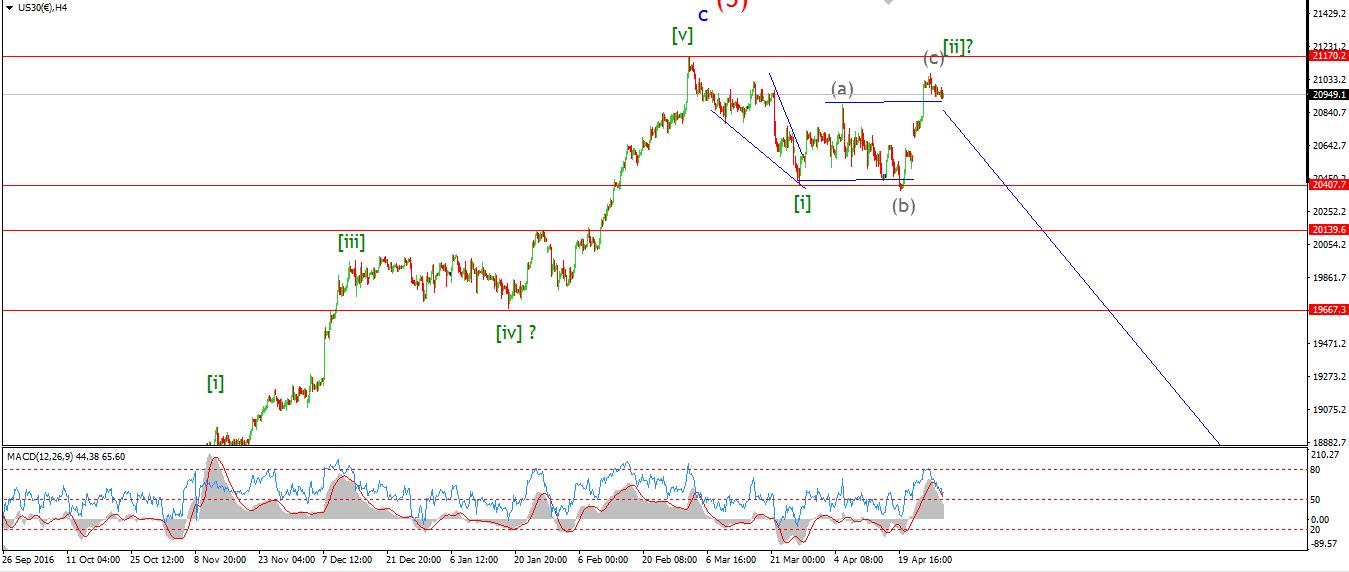
My Bias: market top is in. Wave Structure: Impulsive 5 wave structure, possibly topping in an all time high. Long term wave count: Topped in wave (5) Important risk events: USD: Treasury Sec Mnuchin Speaks, Personal Spending m/m, ISM Manufacturing PMI.
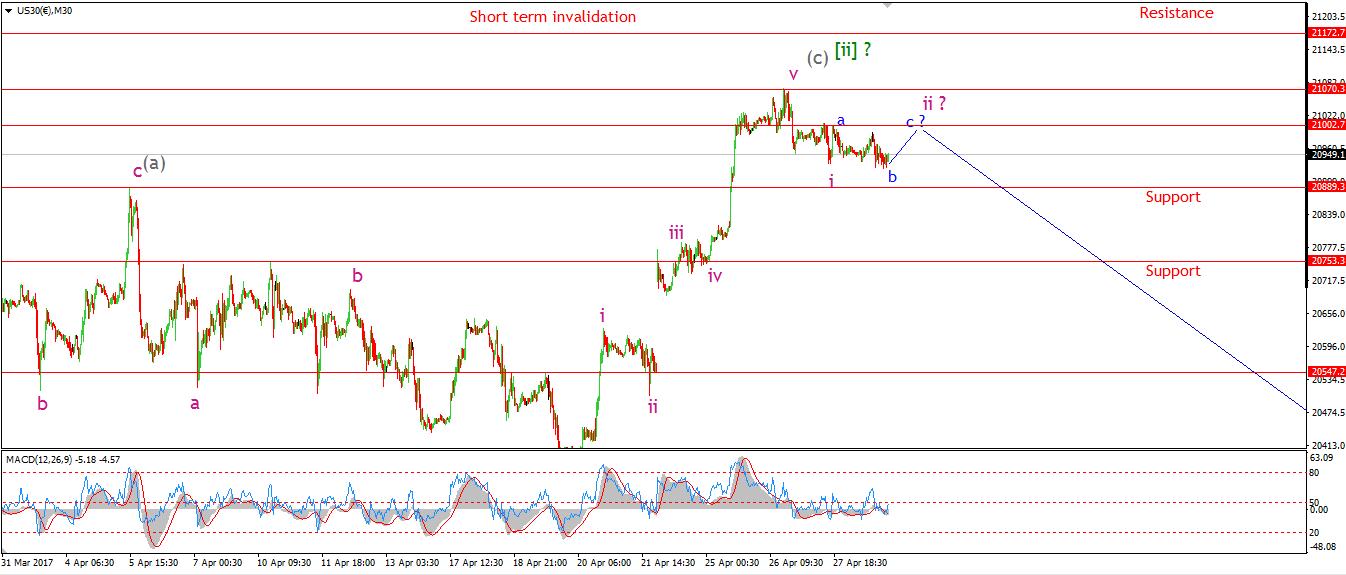
The DOW stuck in a sideways correction today, Which leads me to believe that wave 'ii' pink is still underway. I have labelled waves 'a' and 'b' blue as complete, And wave 'c' blue is expected to carry the price higher for one last gasp of air above 21000 to complete the short term pattern.
The support at 20889 is still key to turning the price structure to the downside. If wave 'iii' pink occurs, then support should give way quickly.
For Monday, watch for a test of 21000 and an impulsive decline off that level.
GOLD
30 min
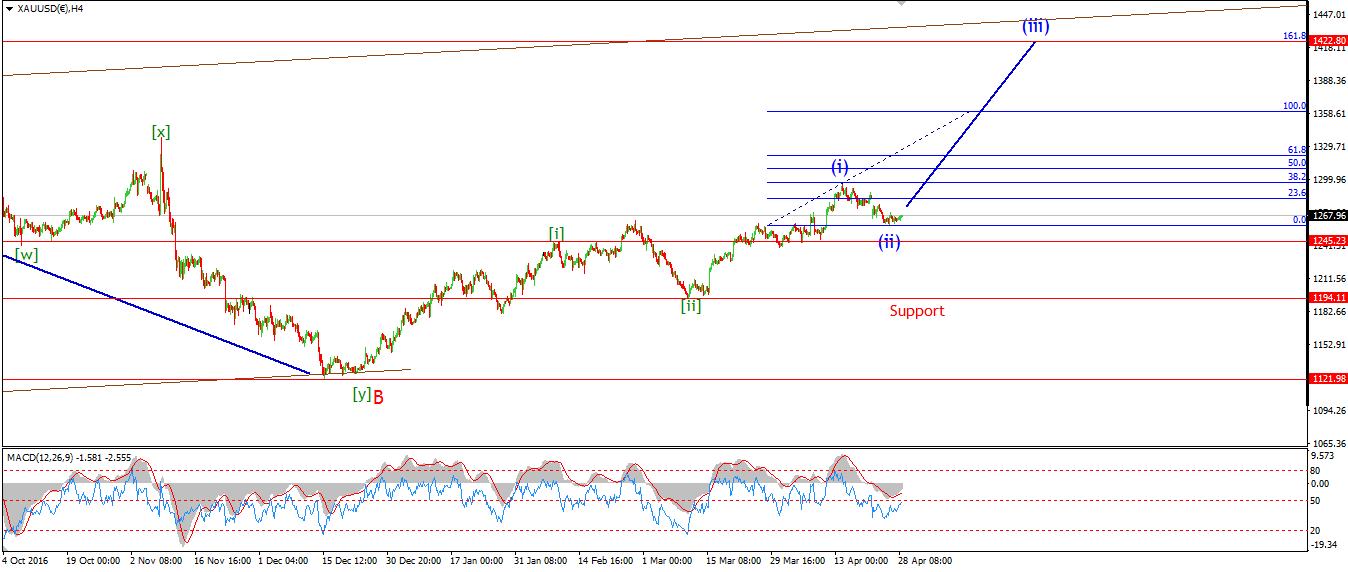
4 Hours
Daily

My Bias: Long towards 1550 Wave Structure: ZigZag correction to the upside. Long term wave count: Topping in wave (B) at 1500 Important risk events: USD: Treasury Sec Mnuchin Speaks, Personal Spending m/m, ISM Manufacturing PMI.
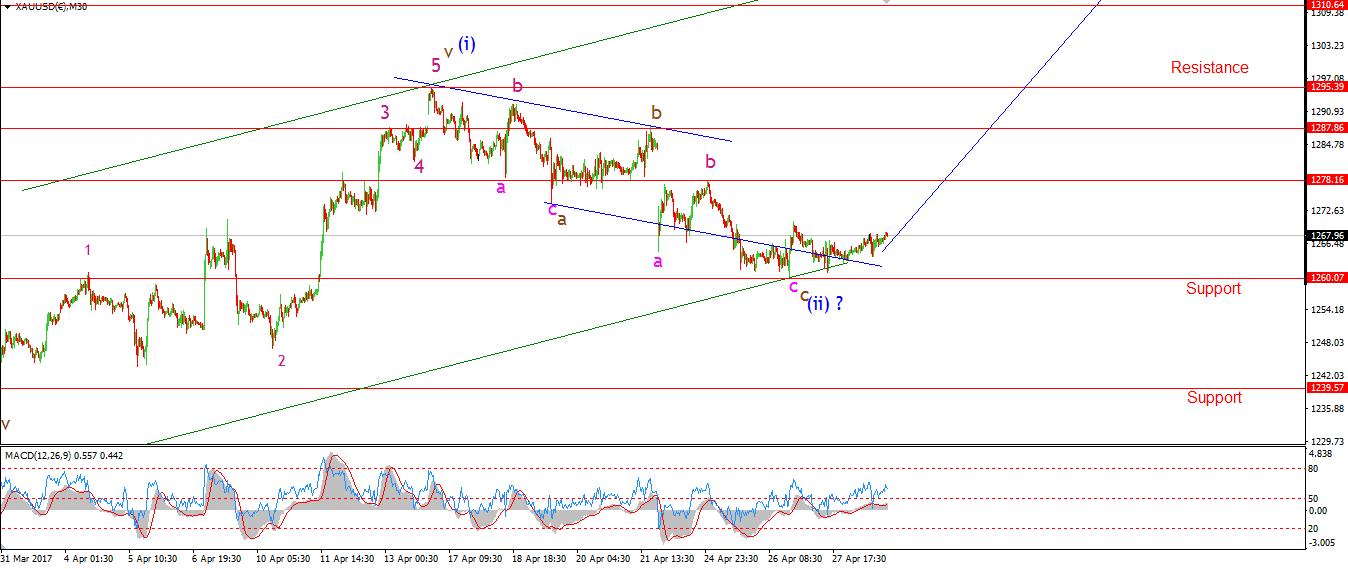
GOLD continues to signal that a turn is on the cards in wave (iii) blue.
The short term price structure has not turned impulsive to the upside just yet, but that can change quickly.
The low at 1260 is labelled as a completed wave (ii) blue. The 4hr momentum indicators are turning up again in a supportive fashion. So for next week, A break of 1278 and the formation of a higher low is the signal I am looking for to indicate wave (iii) blue is underway. Wave (iii) has the potential to carry the price much higher in short order. And the initial target is in the region of 1422 to complete. It is time to prepare now.