
<teaser> Friday’s trading session was bearish, as the broad stock market broke below its Wednesday’s daily low following the ongoing trade war fears. The S&P 500 index fell the lowest since March the 11th and it got close to the 1,750 mark. Will the downtrend continue today? </teaser>
Briefly:
<briefly> Intraday trade: The S&P 500 index lost 1.3% after opening 0.8% lower on Friday. The broad stock market will likely open lower today. Then we may see a consolidation and a flat correction within a downtrend.
Trading position (short-term; our opinion): no positions are justified from the risk/reward perspective. </briefly>
Our short-term outlook is neutral, and our medium-term outlook is neutral:
Short-term outlook (next 1-2 weeks): neutral Medium-term outlook (next 1-3 months): neutral
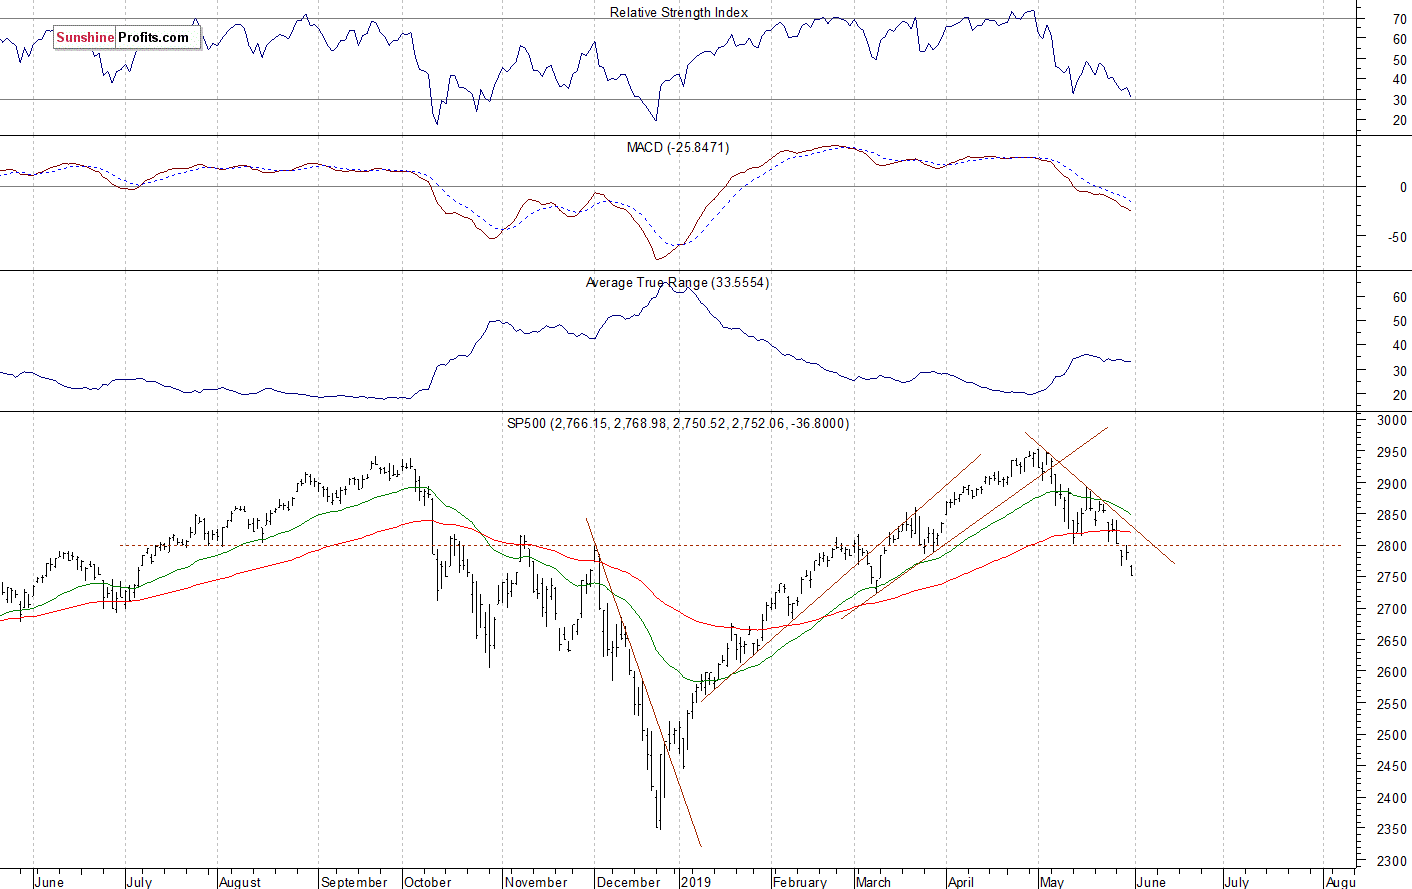
The U.S. stock market indexes lost 1.3-1.5% on Friday, as they accelerated the month-long downtrend following more trade war jitters. The S&P 500 index fell the lowest since the first half of March. It currently trades 6.8% below its May the 1st record high of 2,954.13. The Dow Jones Industrial Average lost 1.4% and the Nasdaq Composite lost 1.5% on Friday.
The nearest important resistance level of the S&P 500 index is now at around 2,765-2,775, marked by Friday’s daily gap down of 2,768.98-2,776.74. The next resistance level is at 2,795-2,800, marked by Wednesday’s daily gap down of 2,792.03-2,801.58. On the other hand, the support level is at 2,750, and the next support level is at 2,720-2,725, marked by the early March local low.
The broad stock market broke above the last year’s high in the early May. But then the index retraced all of the April’s advance. The market also broke below its two-month-long upward trend in the early May. The index fell below the 2,800 mark on Wednesday and it accelerated its month-long decline on Friday, as we can see on the daily chart:
Short-Term Bottom or Just Pause Before Another Leg Down?
Expectations before the opening of today's trading session are negative, because the index futures contracts trade 0.3-0.5% below their Friday’s closing prices. The European stock market indexes have lost 0.2-0.3% so far. Investors will wait for some economic data announcements today: ISM Manufacturing PMI, Construction Spending at 10:00 a.m.
The broad stock market will likely extend its short-term downtrend this morning. Then we may see an attempt at bouncing off the support levels. However, there have been no confirmed positive signals so far.
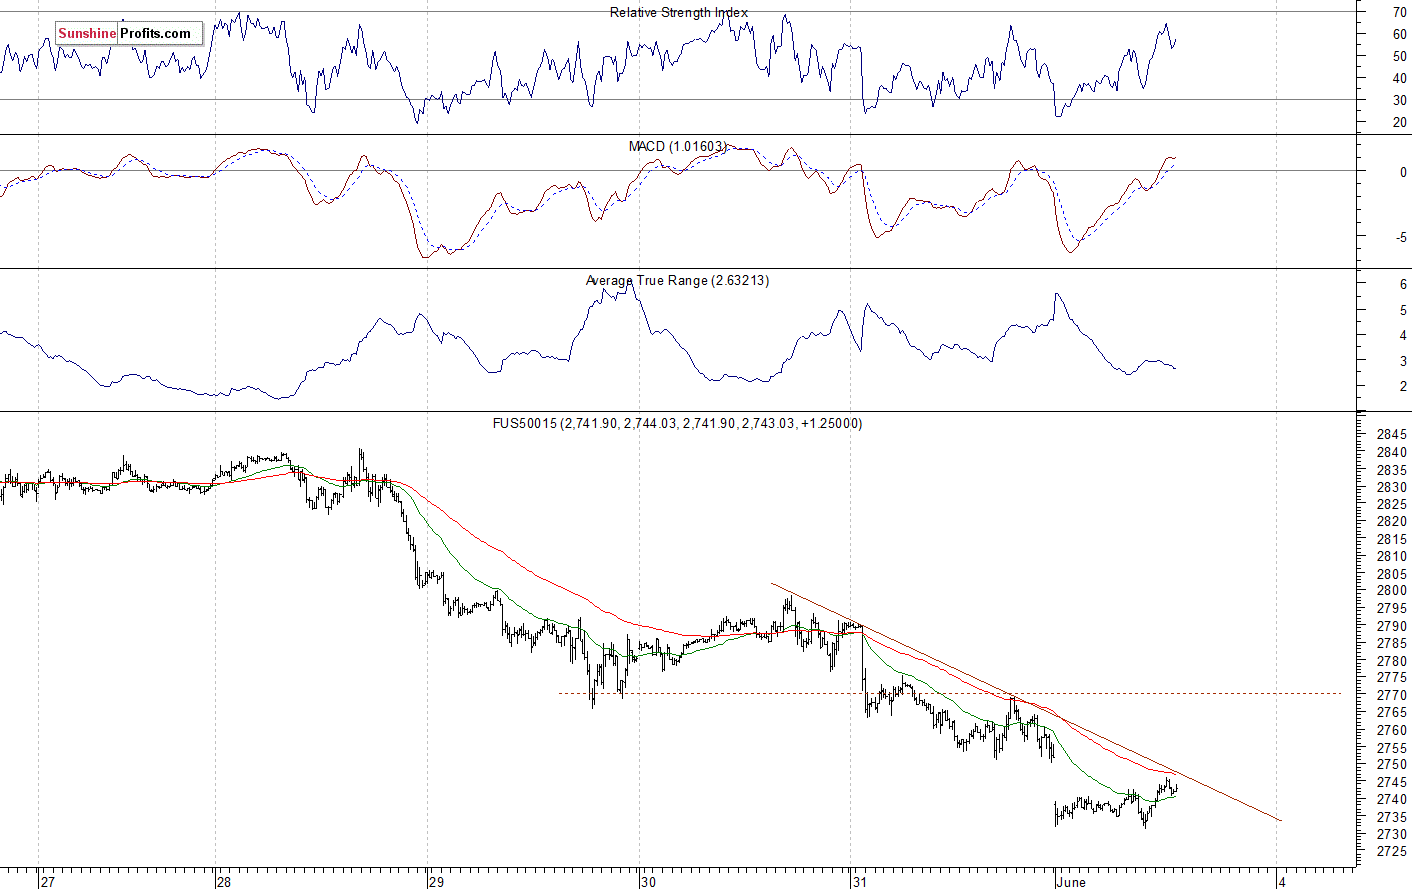
The S&P 500 futures contract trades within an intraday consolidation, as it fluctuates following another overnight sell-off. The nearest important resistance level is now at 2,750, marked by Friday’s local lows. The next resistance level is at 2,765-2,770. On the other hand, the support level is at 2,730-2,735. The futures contract remains below the short-term downward trend line, as the 15-minute chart shows:
Nasdaq Closer to 7,000
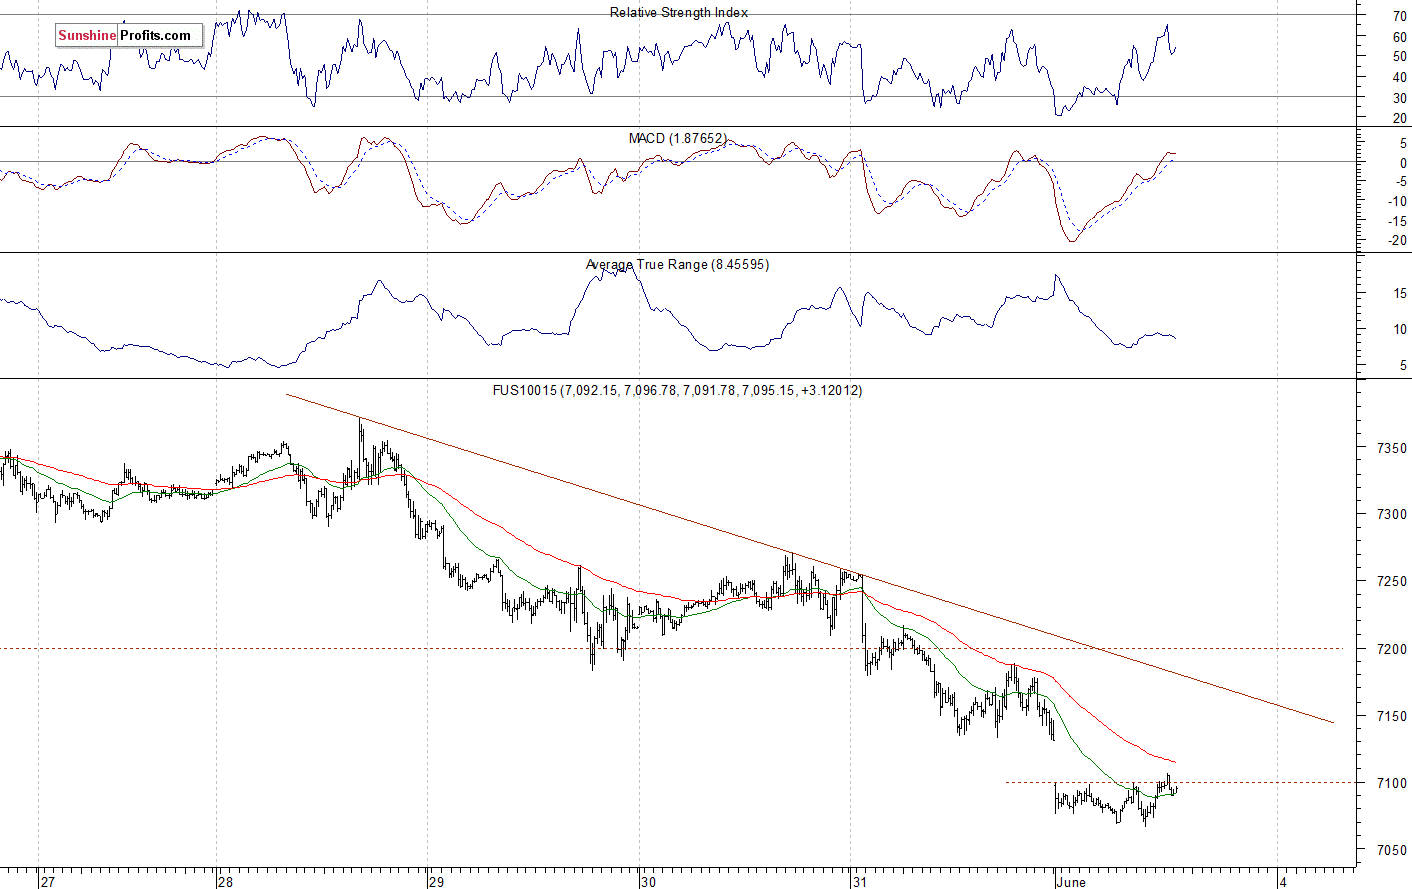
The technology Nasdaq 100 futures contract follows a similar path, as it fluctuates after opening lower overnight. It broke below the 7,100 mark. The nearest important support level is at around 7,000-7,050. The Nasdaq futures contract trades along the 7,100 mark this morning, as we can see on the 15-minute chart:
Apple, Microsoft at Support Levels
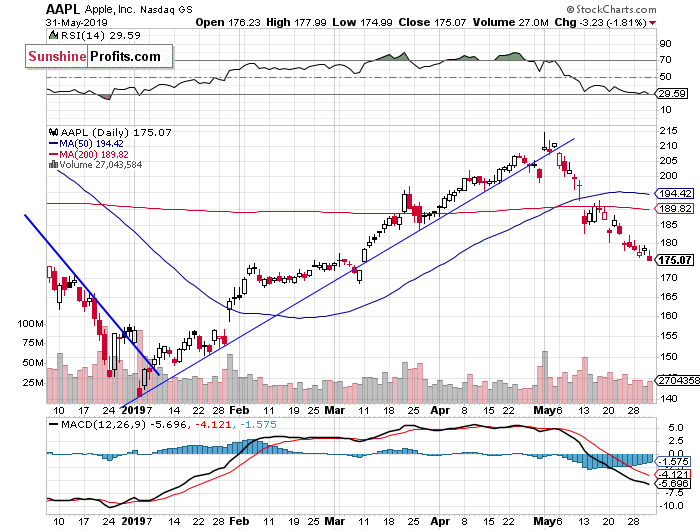
Let's take a look at the Apple, Inc. stock (AAPL) daily chart (chart courtesy of http://stockcharts.com). The stock extended its rally on May the 1st following the quarterly earnings release. Then the price reversed the upward course and broke below the medium-term upward trend line. Since then it continues trading within a downtrend. The nearest important support level remains at $175:
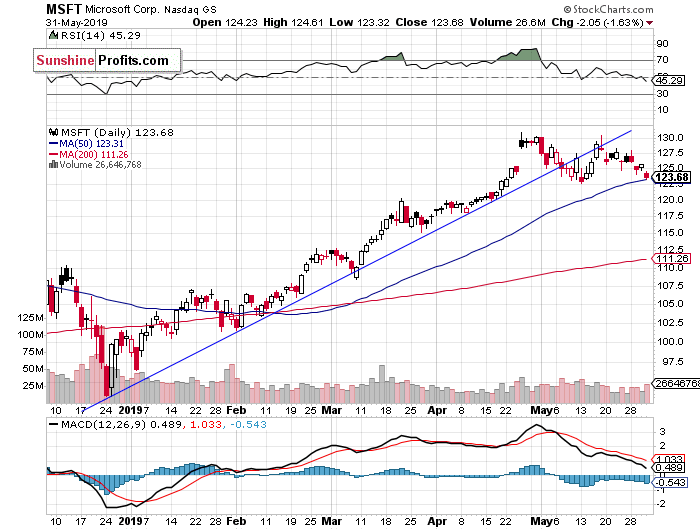
Now let's take a look at the daily chart of Microsoft Corp. (MSFT). The stock accelerated its uptrend in late April, as it reached the new record high of $131.37. Since then, the market is trading within a consolidation. On Friday it got back to the previous low:
Dow Jones Also Lower
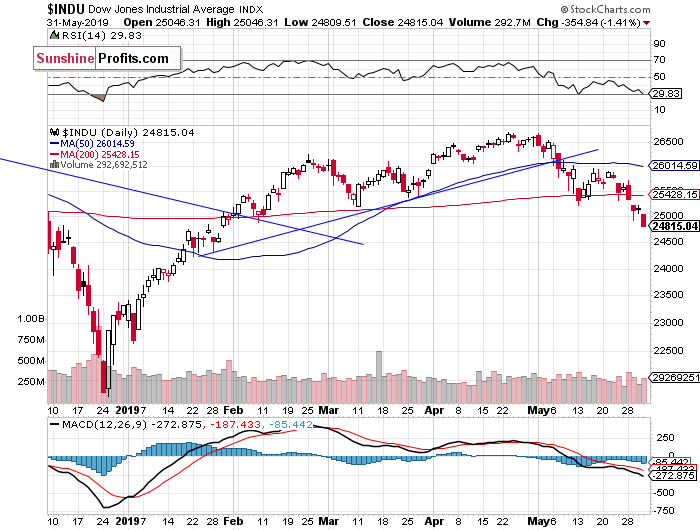
The Dow Jones Industrial Average has been relatively weaker than the broad stock market since February. The resistance level remained at around 26,800-27,000, marked by the last year’s topping pattern and the record high of 26,951.8. Last week the blue-chip stocks’ gauge followed the broad stock market, as it accelerated the downtrend. The market broke below its important 200-day moving average, and on Friday it fell below 25,000 mark. There have been no confirmed positive signals so far:
Nikkei Extending Downtrend
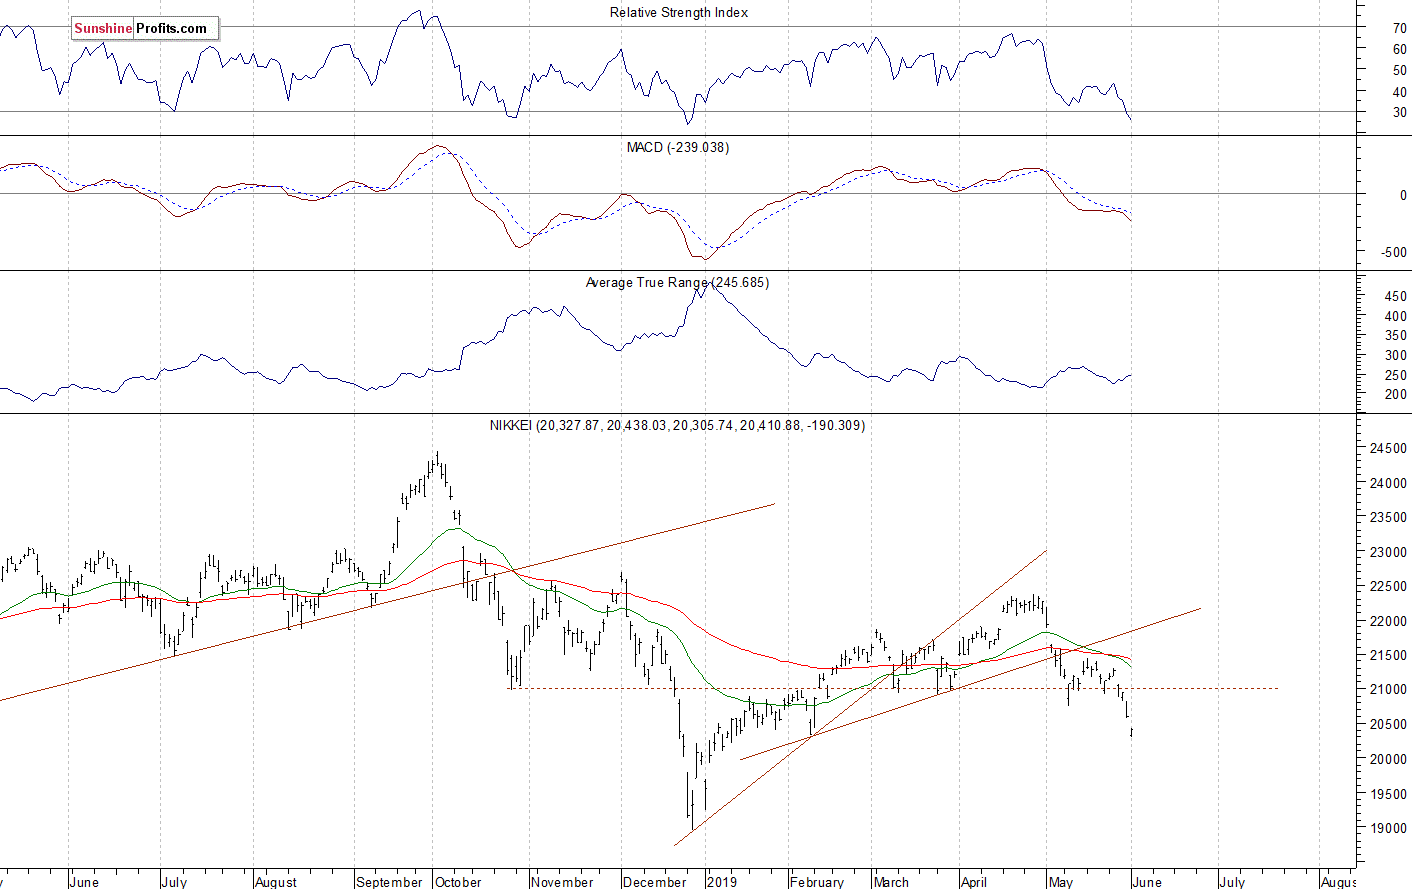
Let's take a look at the Japanese Nikkei 225 index. It accelerated the downtrend today, as it fell to the early February low of around 20,300. The market trades within a month-long correction. If it breaks the 20,000 mark, we could see more selling pressure:
The S&P 500 index accelerated its short-term downtrend on Friday, as it fell below the Wednesday’s local low. It was the lowest since the first half of March. It seems that the decline will extend today following the ongoing trade war fears. However, we could see an attempt at retracing some of the recent sell-off.
<summary> Concluding, the S&P 500 index will likely open lower again today. The market may break slightly below the support level of 2,750. Then it could retrace some of the decline. </summary>
Trading position (short-term; our opinion): no positions are justified from the risk/reward perspective.
Thank you.
Read more by MarketSlant Editor


