
Earnings season started this past week and, as anticipated, they were mostly down year-over-year. The table below shows a number of examples. It seems that the market was just happy to see earnings at all, and ignored the fact that they were down year over year.
Company
Symbol
Actual EPS
Year-Ago
Alcoa
AA
$0.07
$0.28
Fastenal
FAST
$0.44
$0.43
CSX
CSX
$0.37
$0.45
JPMorgan Chase
JPM
$1.35
$1.45
Bank of America
BAC
$0.21
$0.27
BlackRock
BLK
$4.25
$4.89
PNC
PNC
$1.68
$1.75
Progressive
PGR
$0.44
$0.50
Wells Fargo
WFC
$0.99
$1.04
Charles Schwab
SCHW
$0.29
$0.22
Citigroup
C
$1.10
$1.52
The economic data wasn’t exactly warm and fuzzy either (table below), but that too was ignored and equities climbed higher, likely accelerated by short covering (which won’t last).
Release
Actual
Prior
PPI
-0.1%
-0.2%
Core PPI
-0.1%
0.0%
Retail Sales
-0.3%
0.0%
Retail Sales, Ex Auto
0.2%
0.0%
Business Inventories
-0.1%
-0.1%
CPI
0.1%
-0.2%
Core CPI
0.1%
0.3%
Initial Claims
253K
266K
Continuing Claims
2171K
2189K
Empire Manufacturing
9.6
0.6
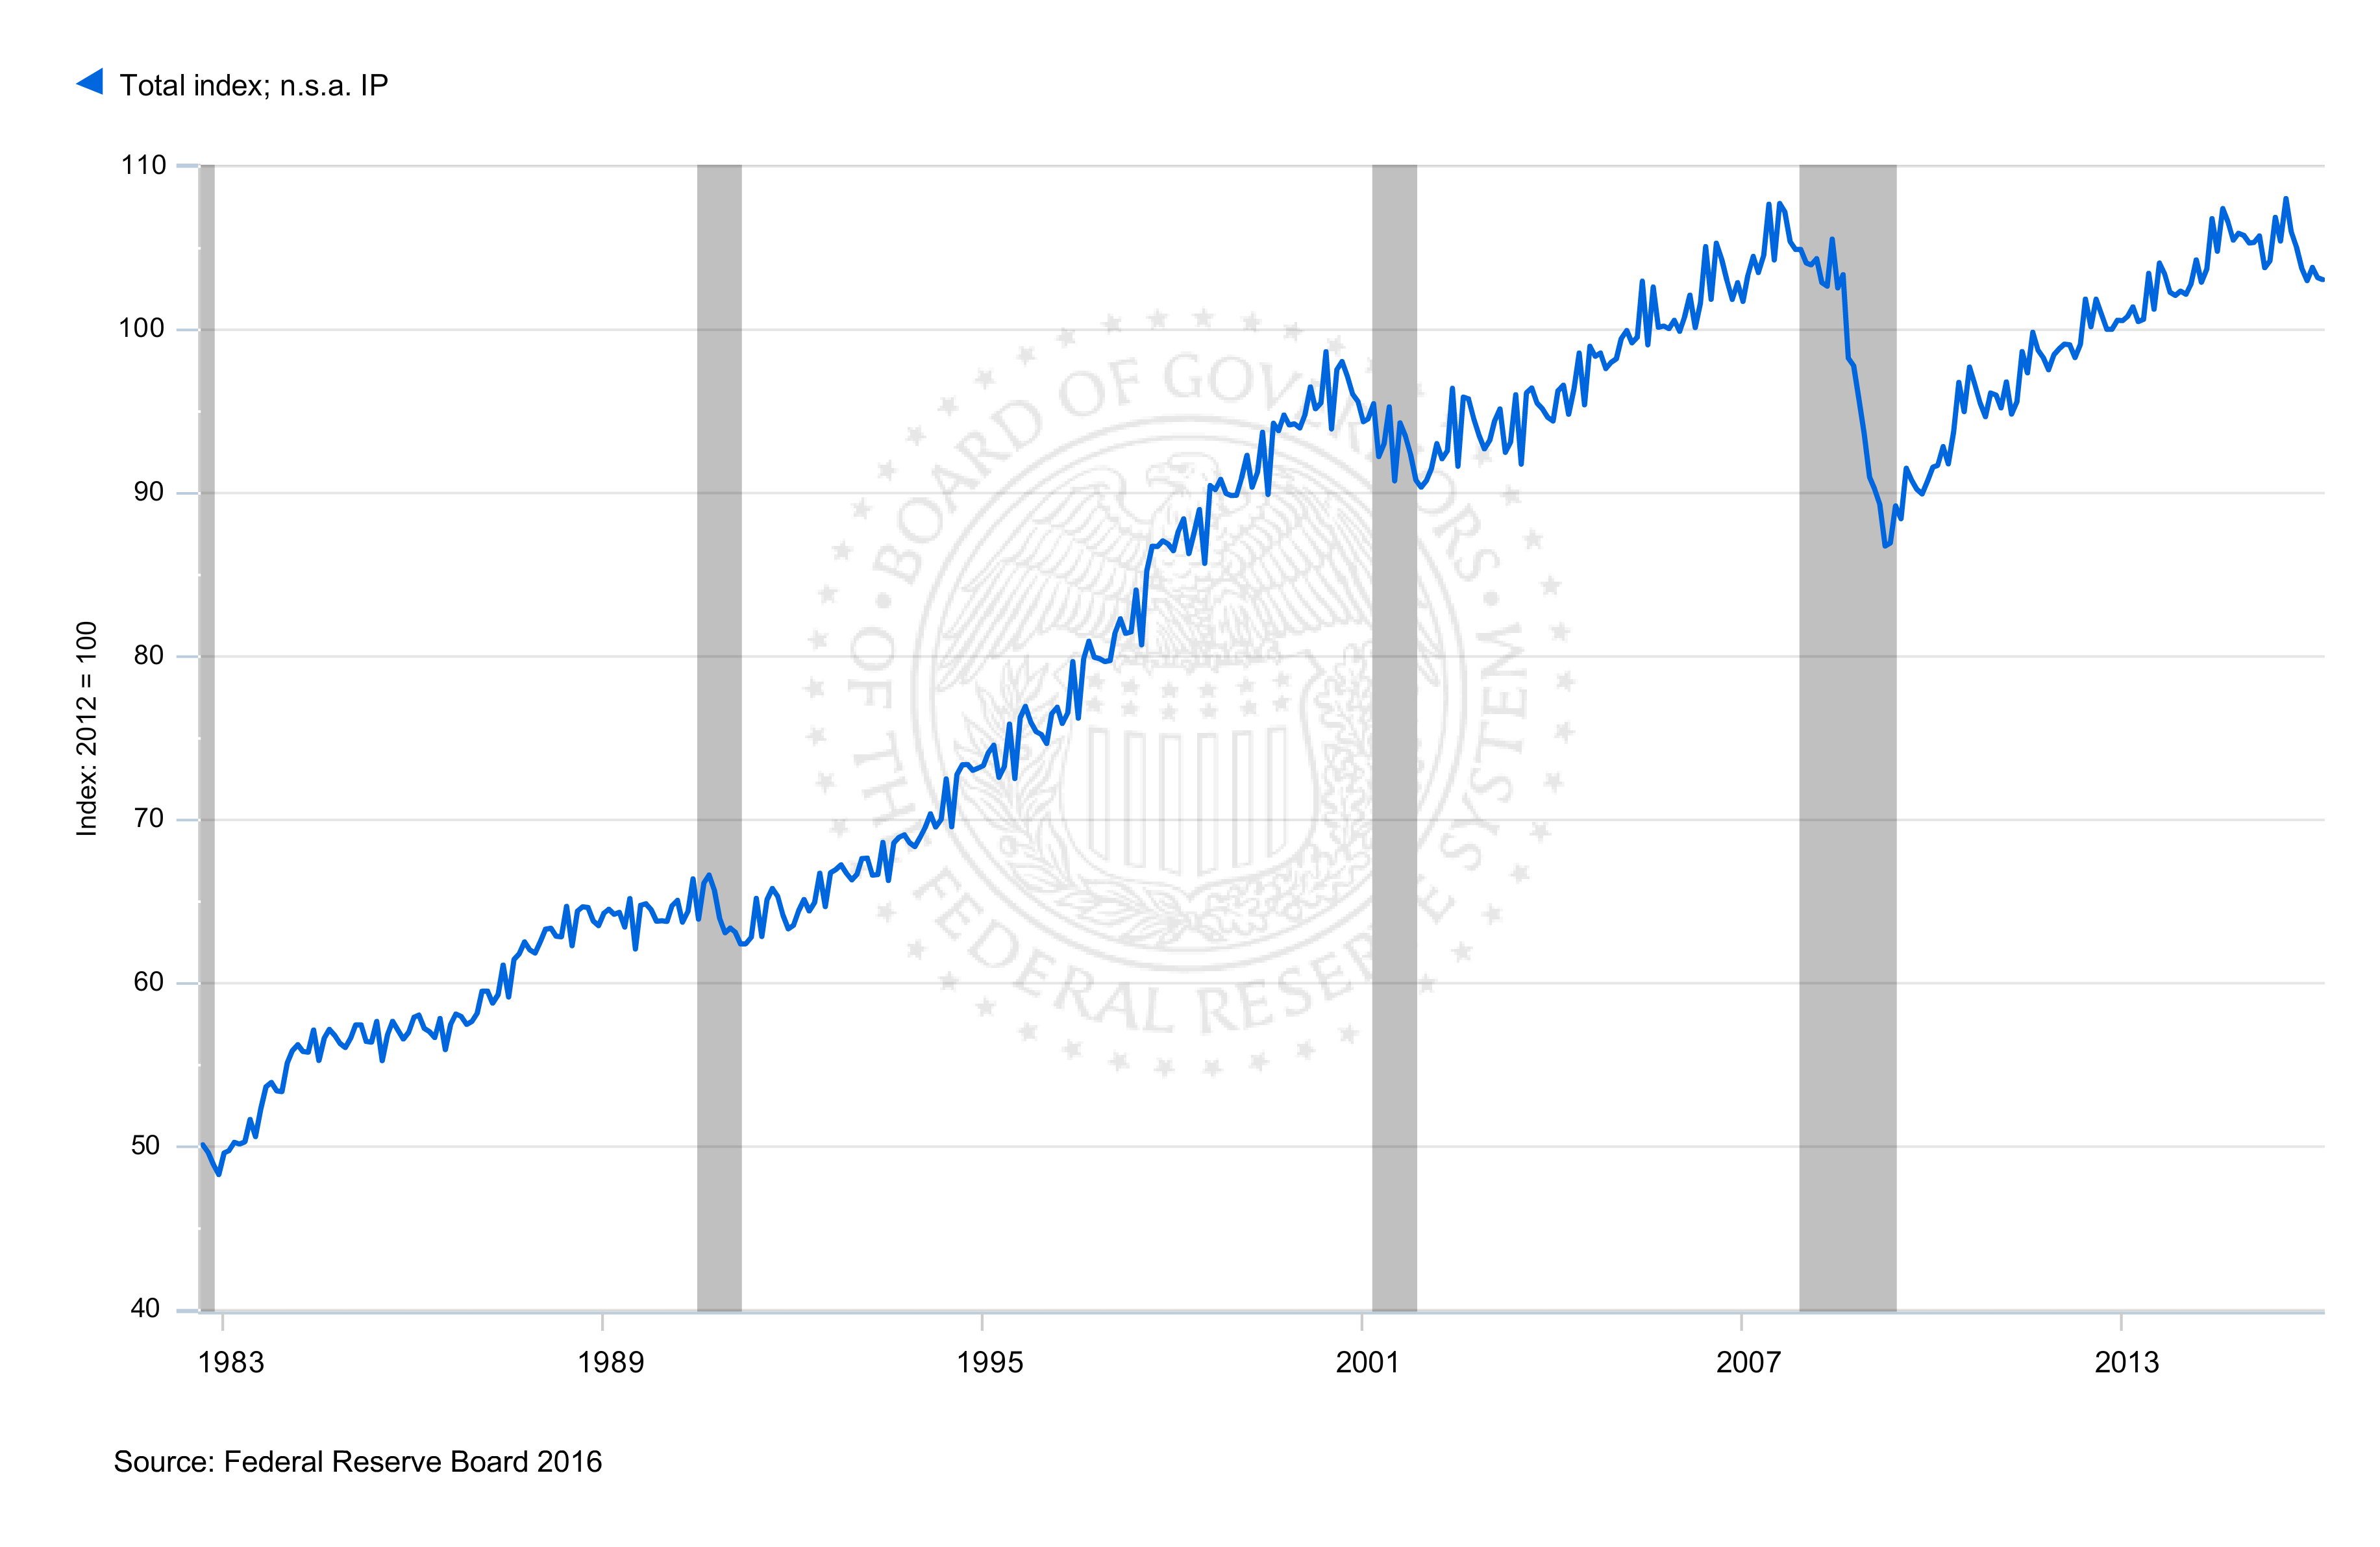
Industrial Production
-0.6%
-0.6%
Capacity Utilization
74.8%
75.3%
Consumer Sentiment
89.7
91.0
The media has pointed out the important drop in industrial production, but the market wasn’t listening to that either.
Industrial Production and Utilization
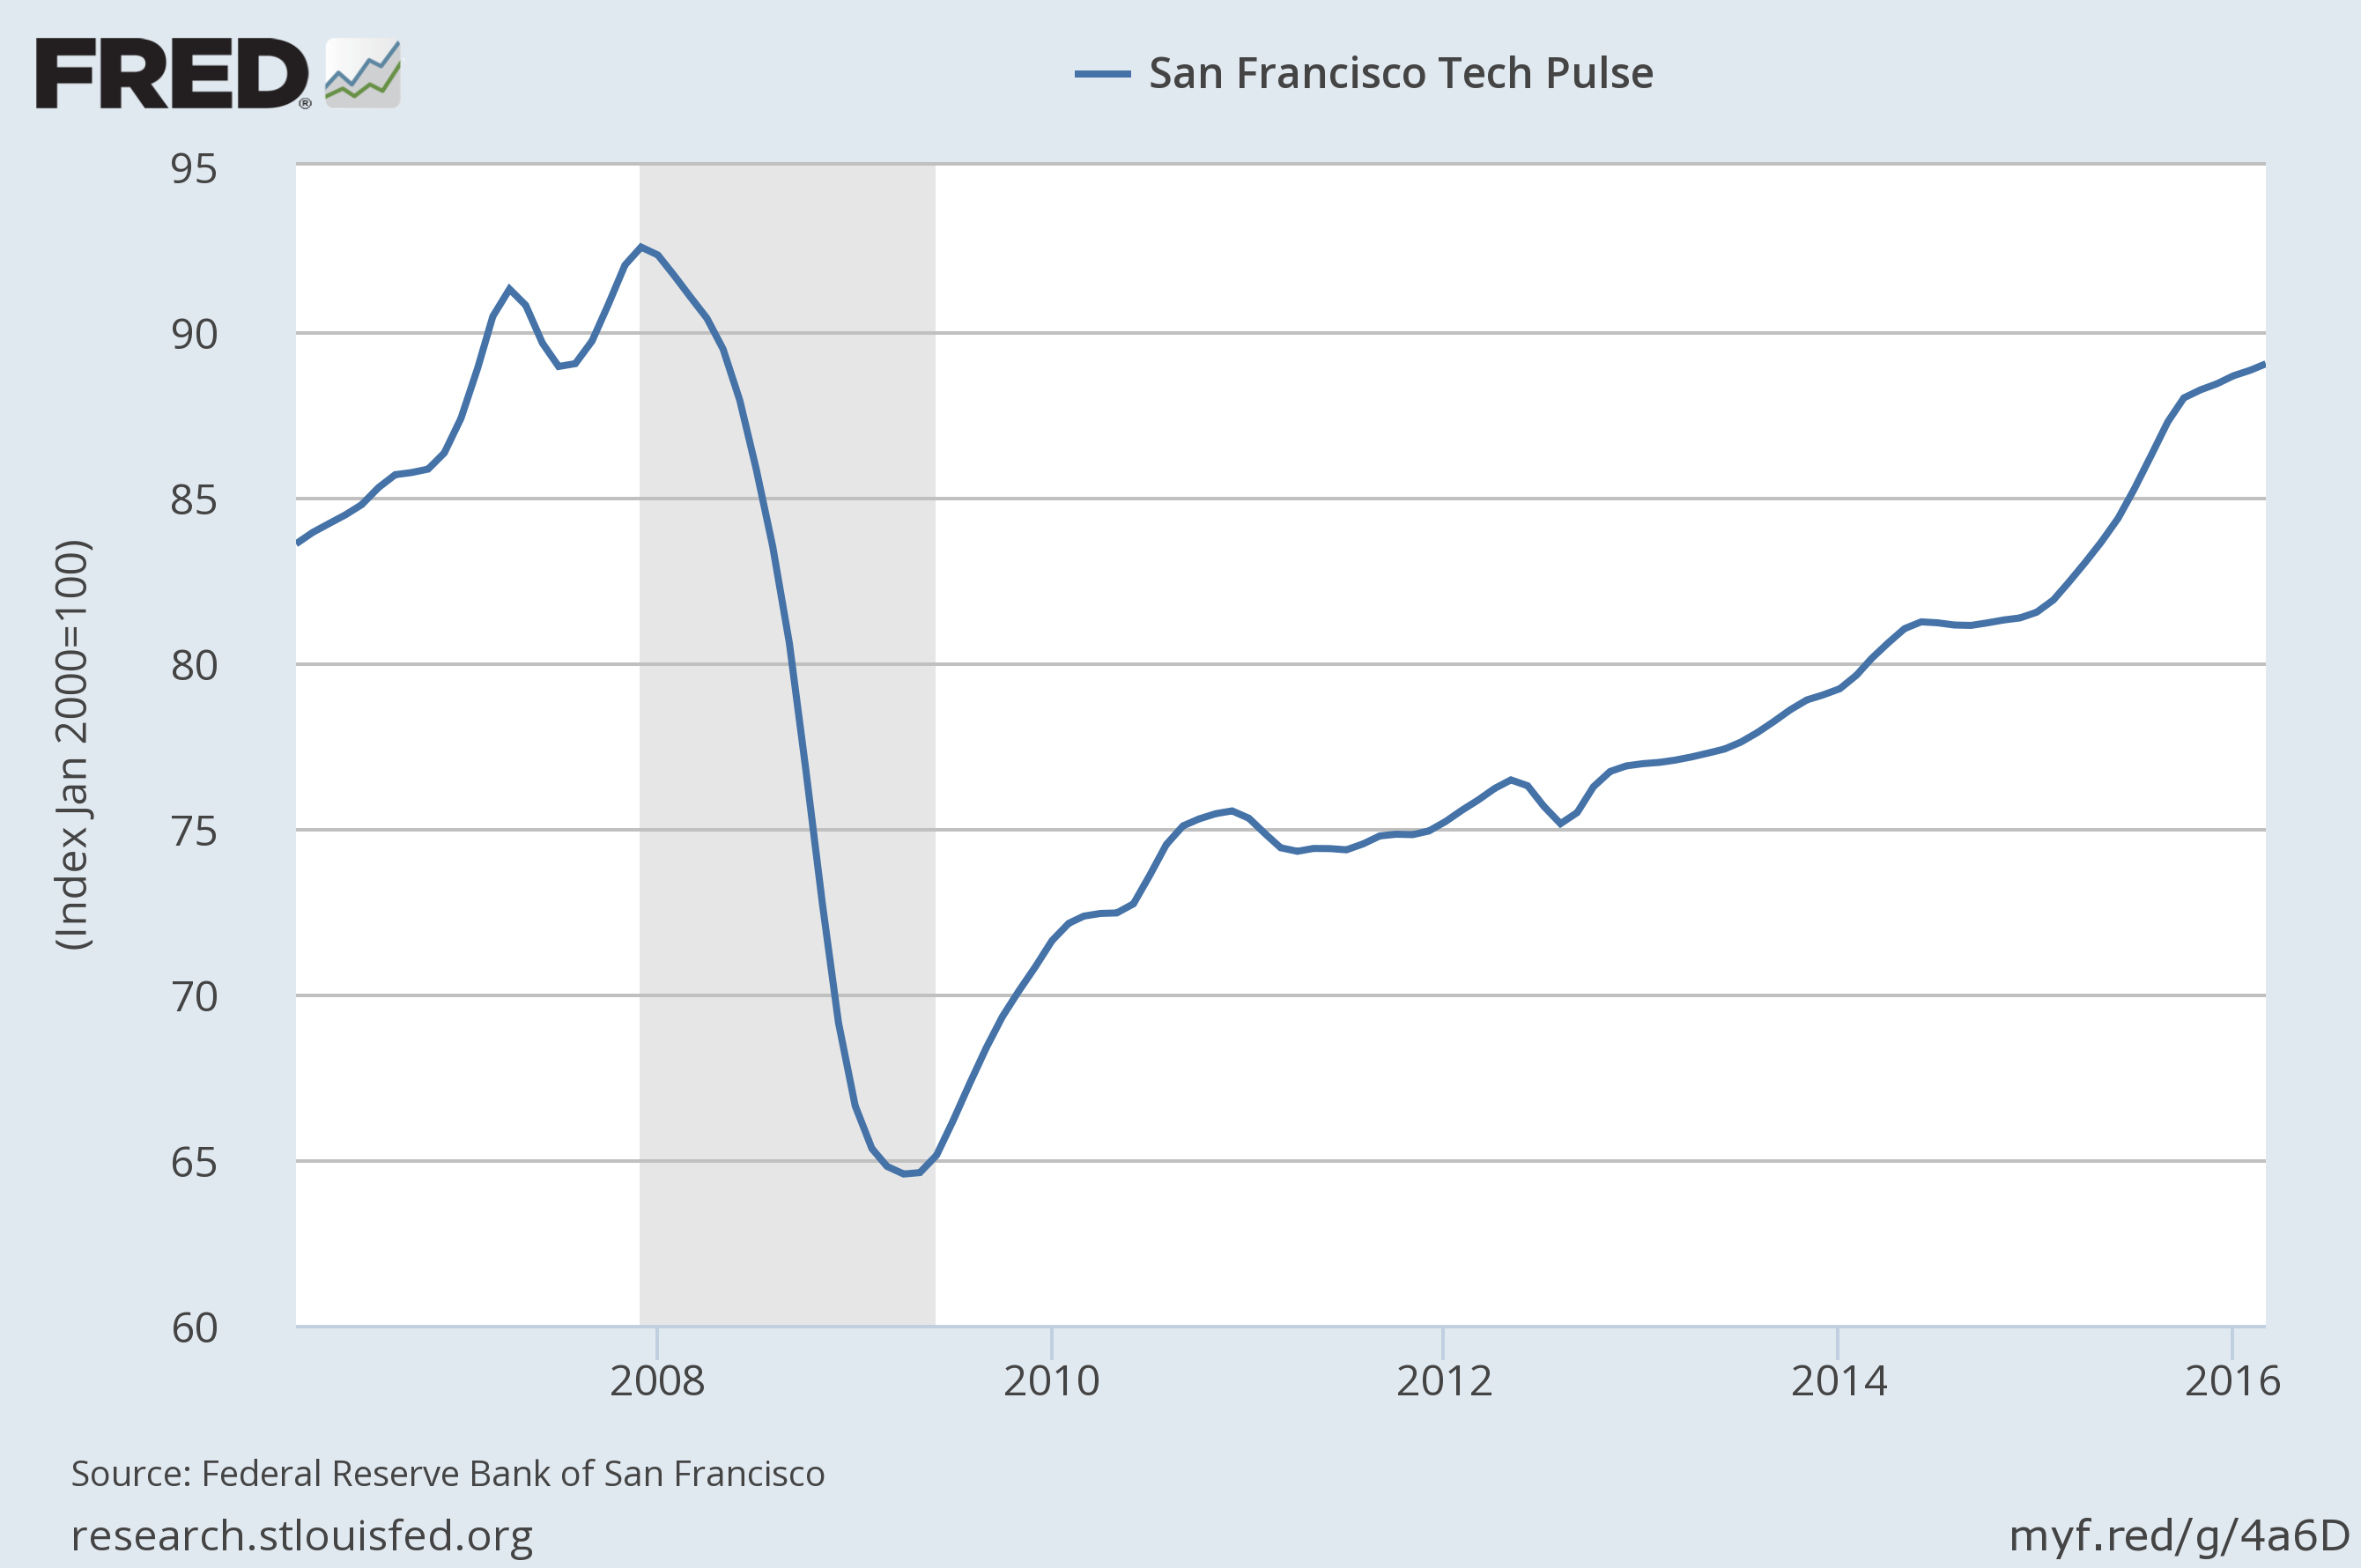
Maybe that was because they were looking at the health of the newer tech industry numbers which show that it continues to grow non-stop (table below).
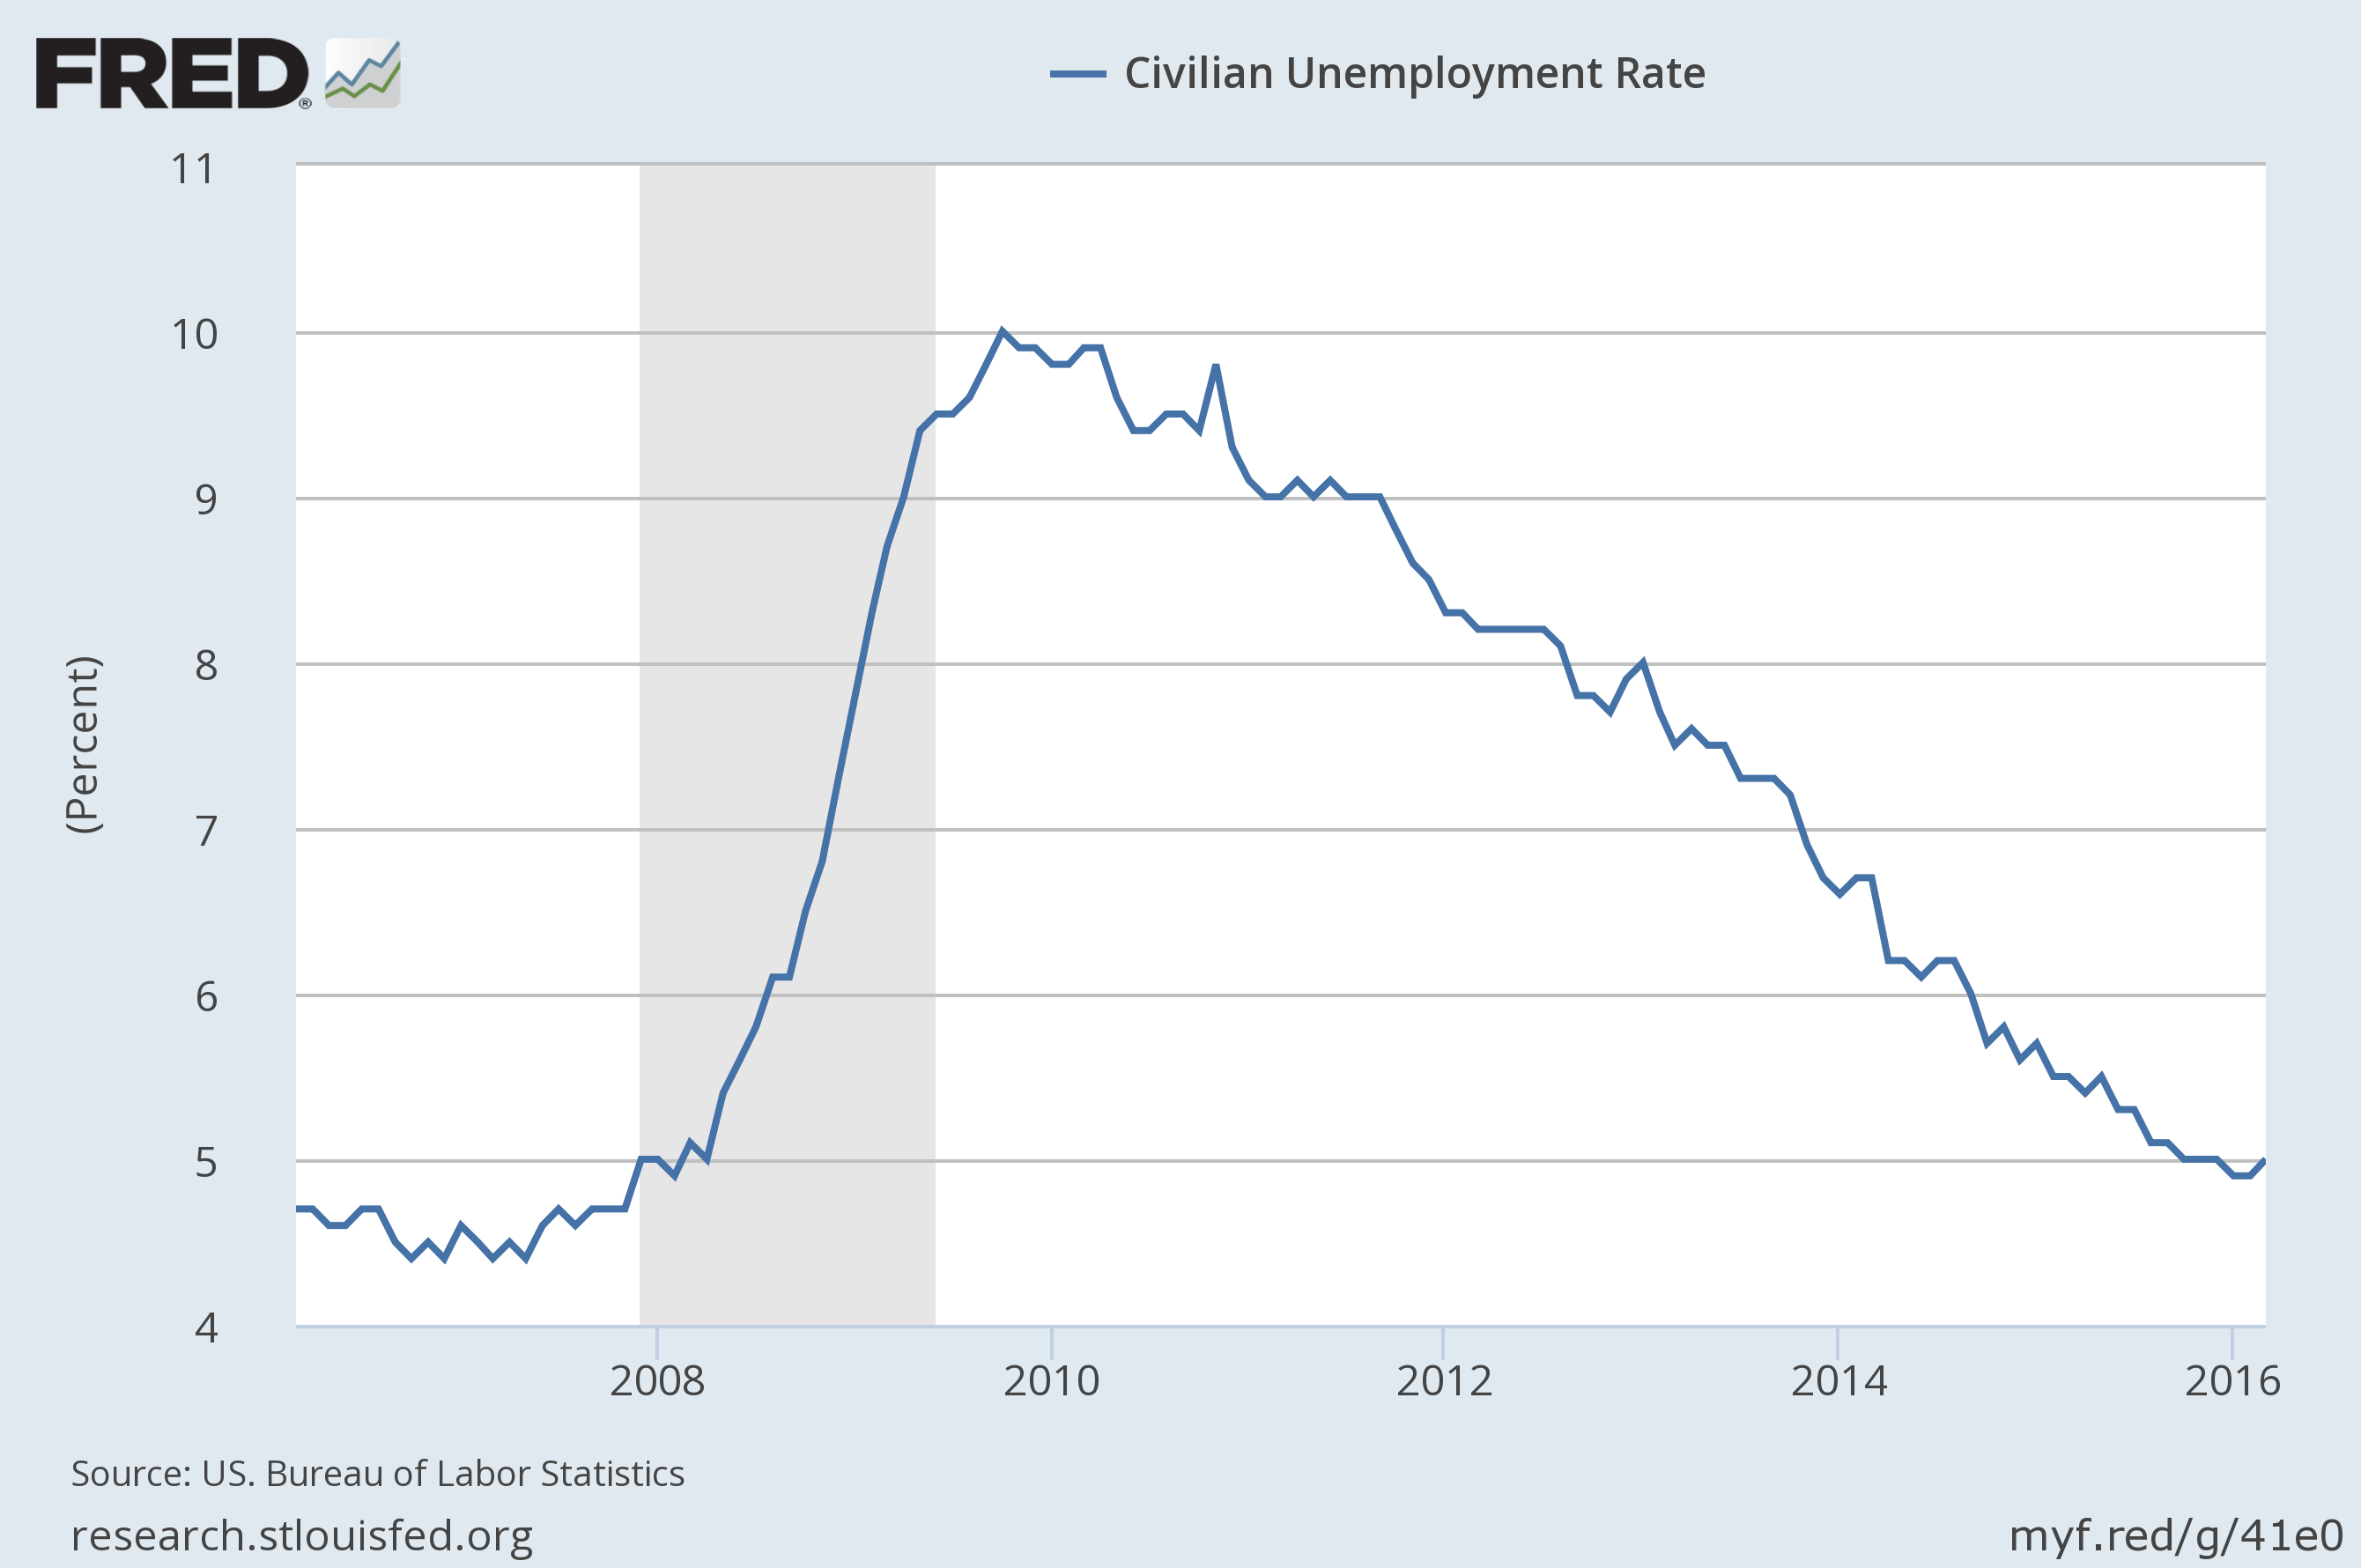
Or maybe the market was focused on the continuing low unemployment rate.
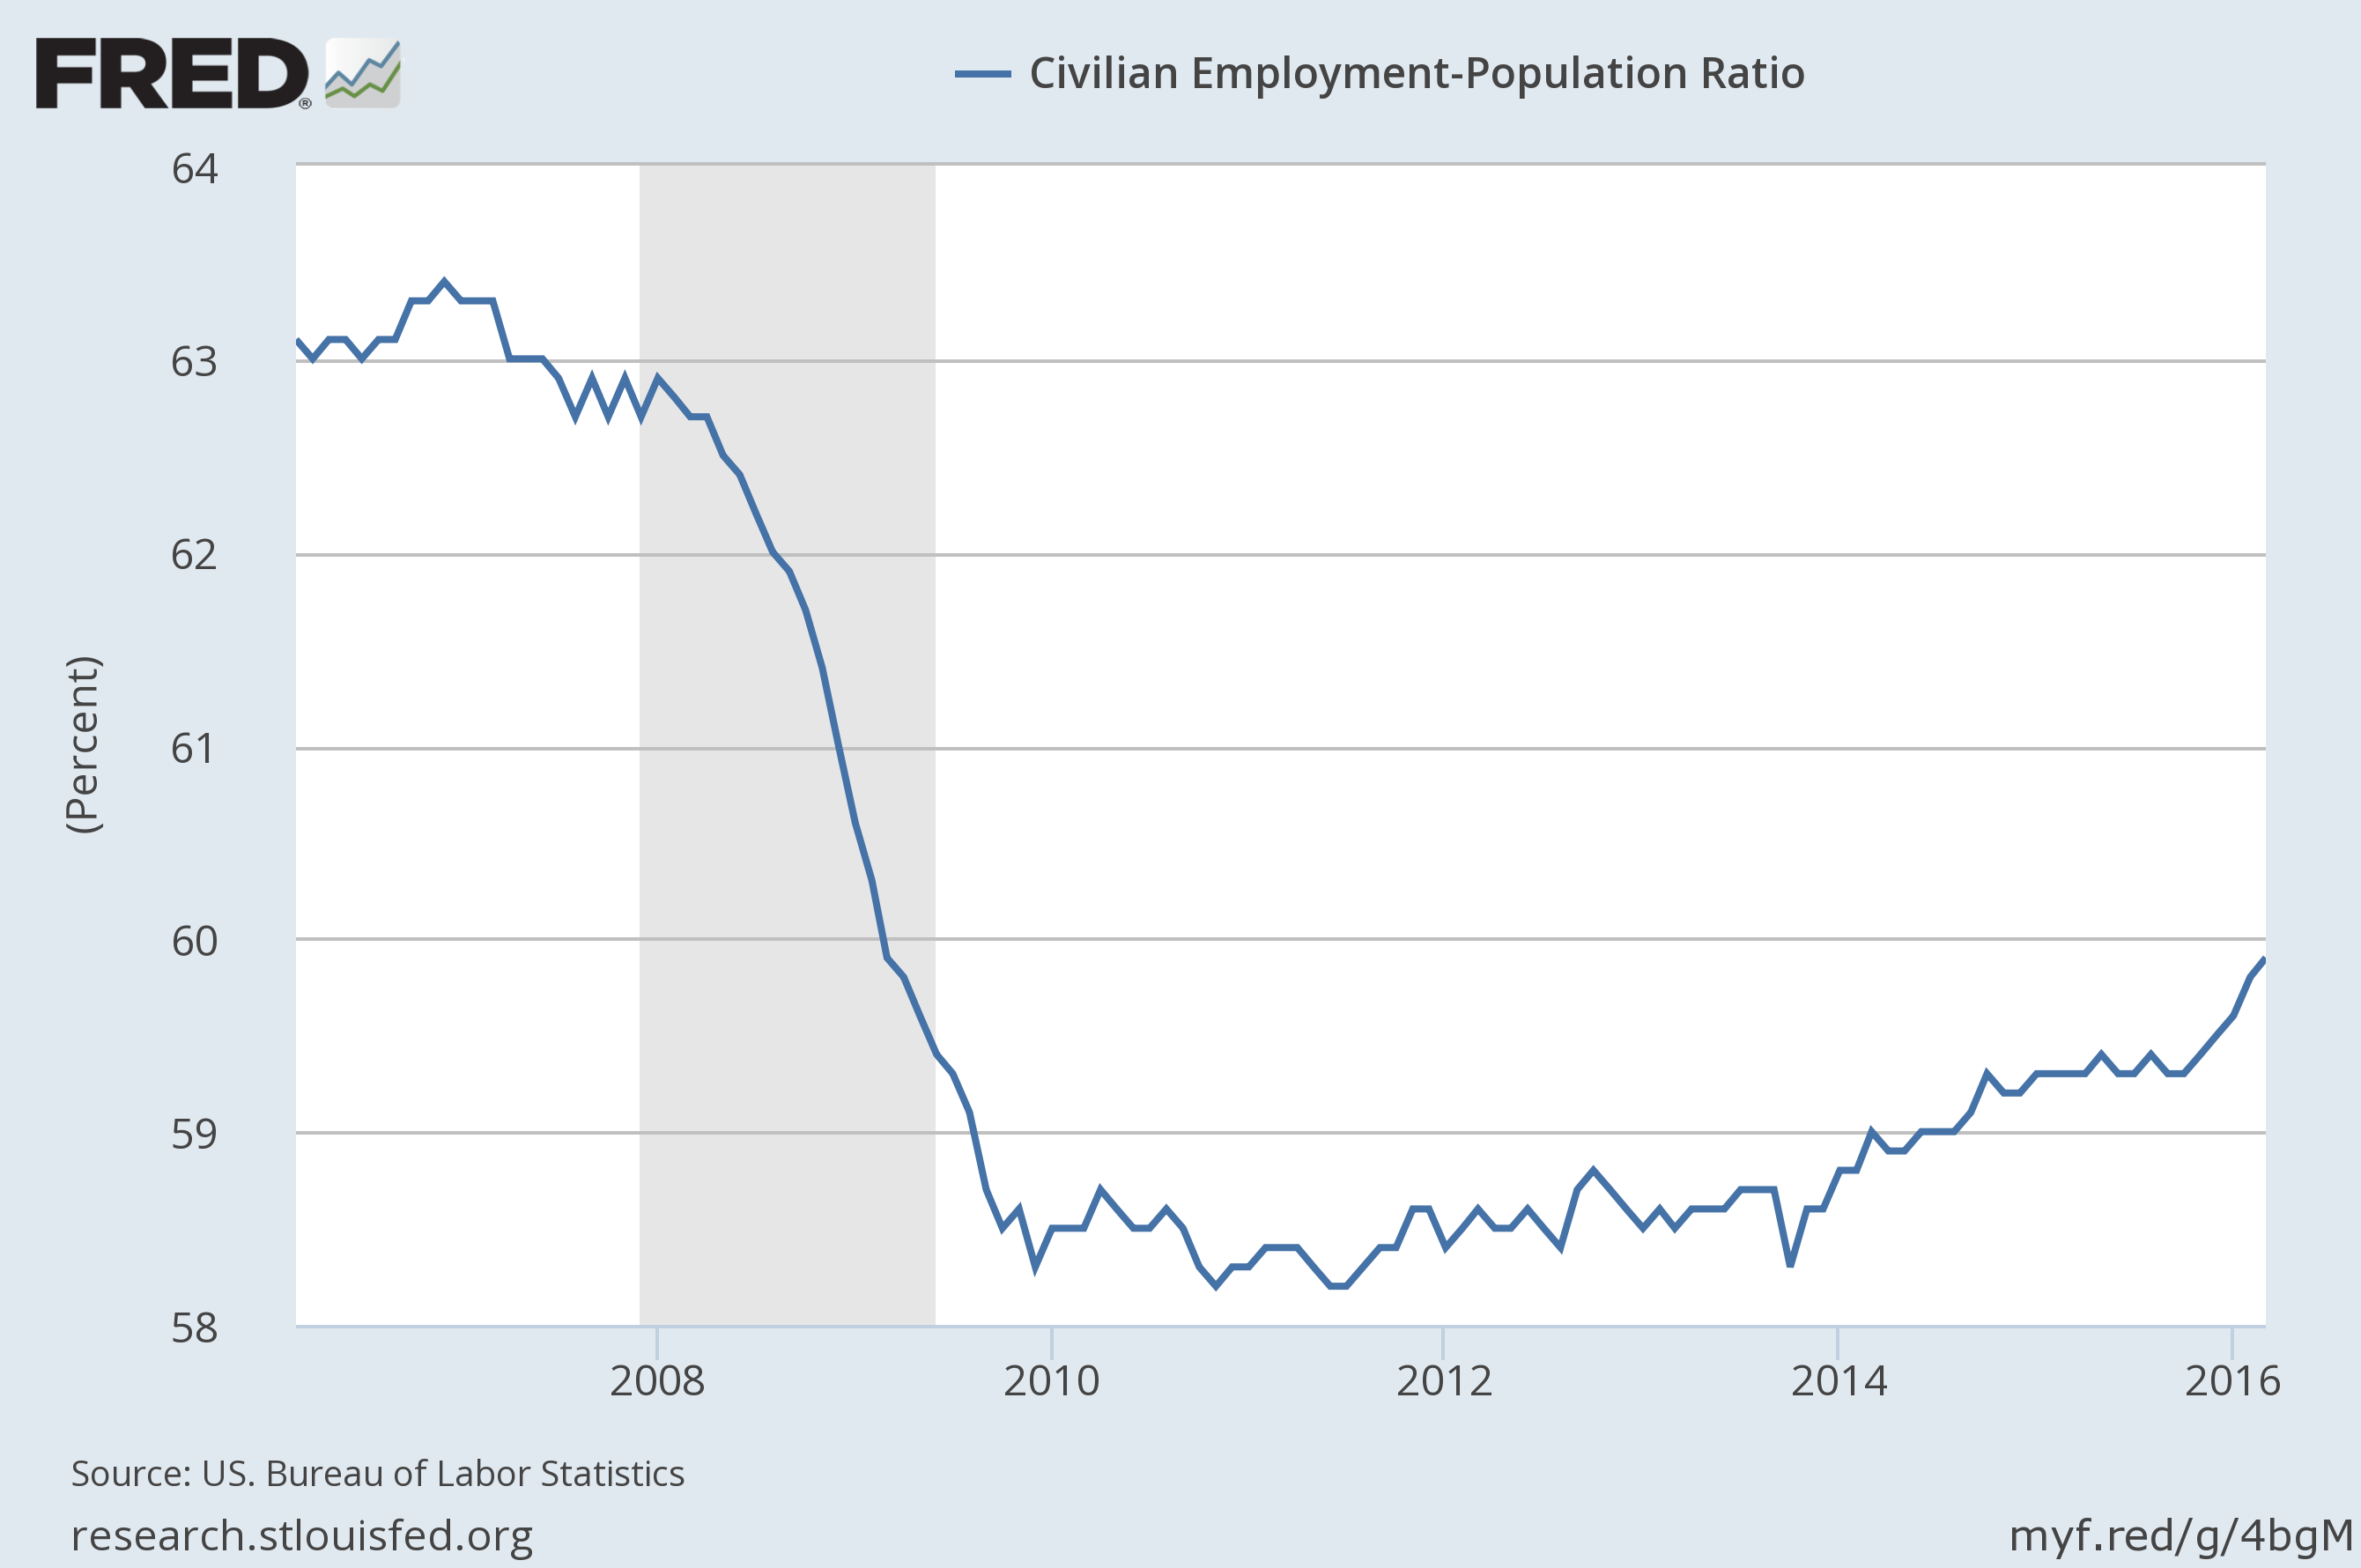
We doubt that the market was looking at the population-employment ratio which has yet to move above 60%. It was above 63% before the great recession.
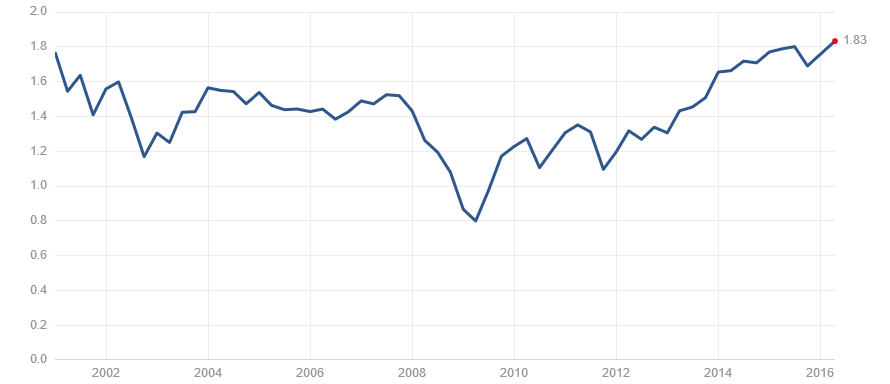
It certainly wasn’t focused on the price-to-sales ratio for the S&S 500 which at 1.83 is the highest level in fourteen years.
S&P 500 Price to Sales Ratio
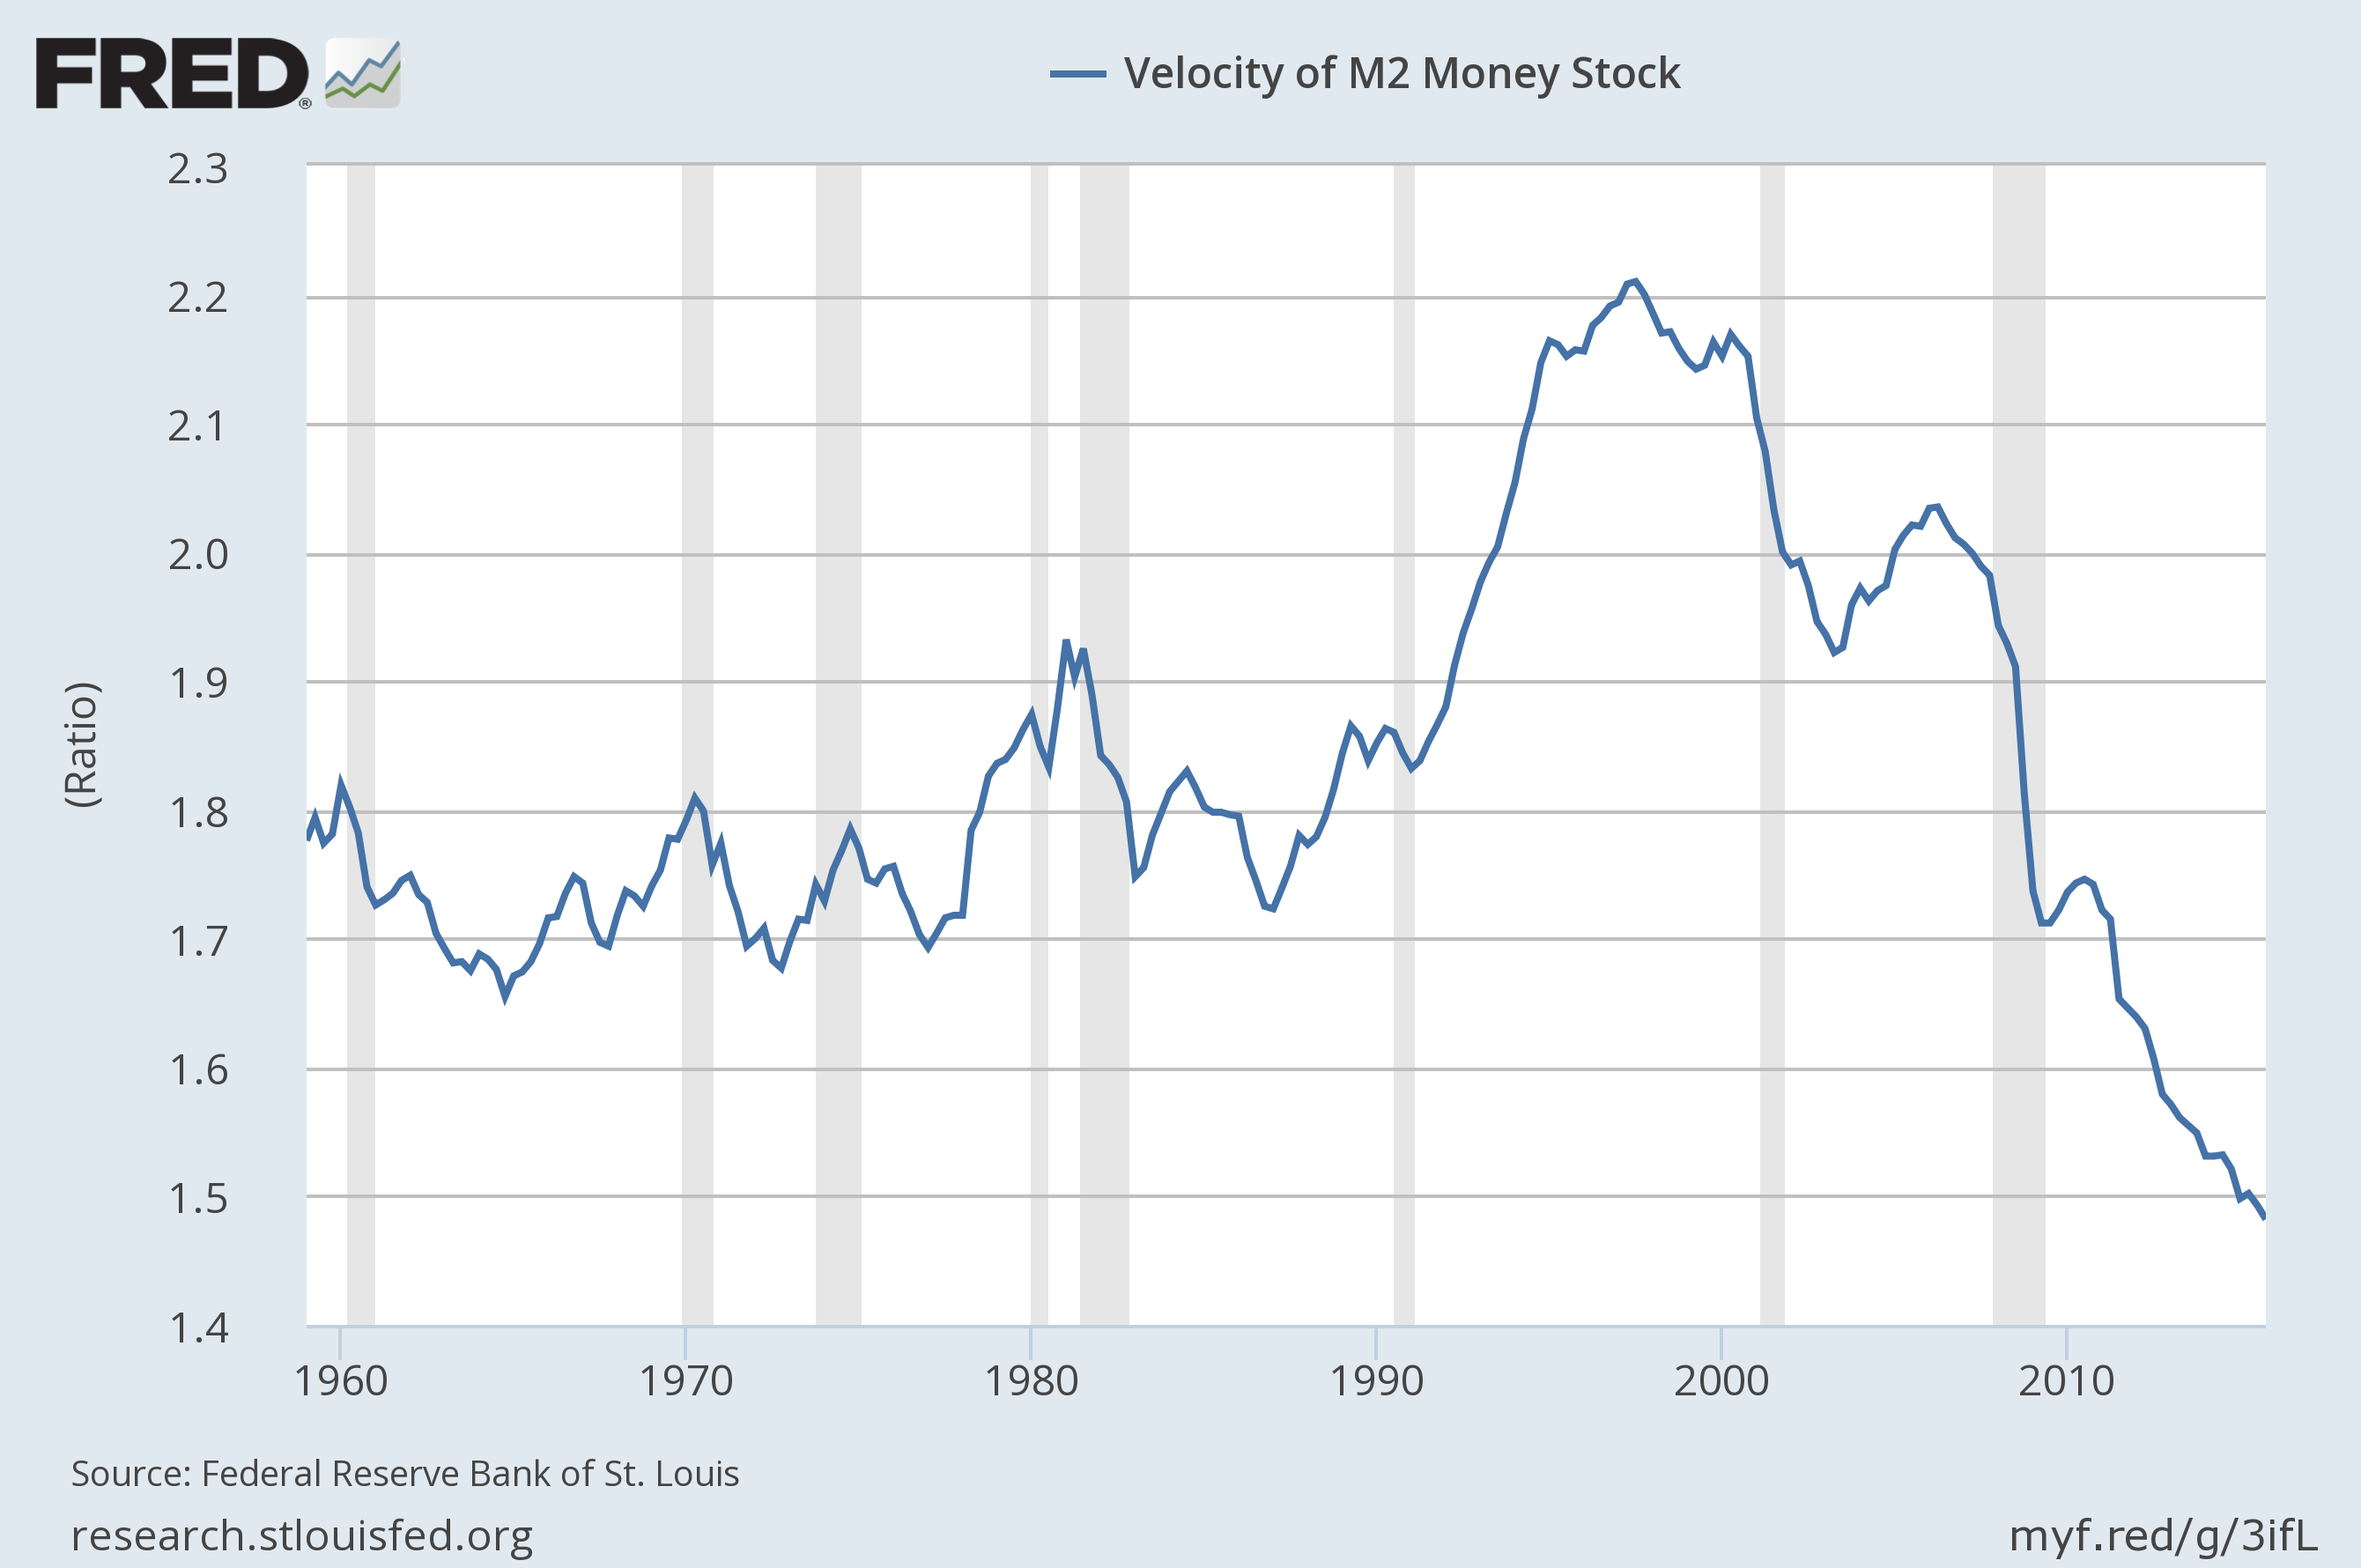
It is equally unlikely that the market noticed that the velocity of money is at its lowest level in the last six decades.
Whatever it was that the market was focused on, it caused equities to get chased higher.
Our own Price Modelling System is signalling a weak negative bias, which does not rule out a further short-term rise in prices at this point, however, there is more potential for a pull-back than there is for new all-time highs.
The chart below, high-lights the local tops on the S&P and shows how they correlate with:
- Low bear assets
- High bull assets
- High bull sentiment
- Low bear sentiment
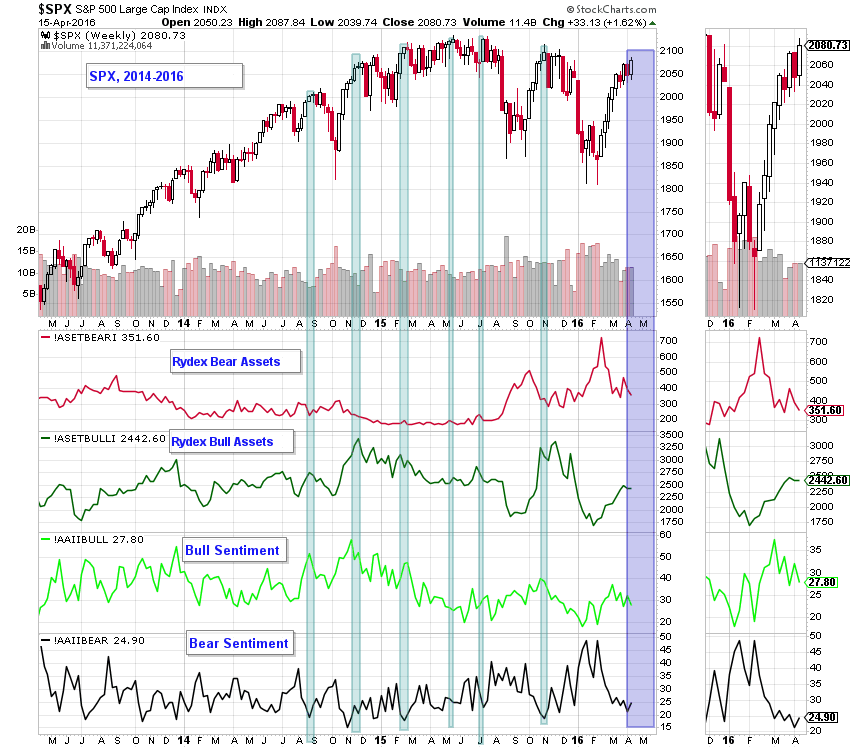
Little has changed since last week (see purple area and thumbnail);
- bear assets dropped slightly (bearish)
- bull assets were essentially unchanged (neutral)
- bull sentiment was lower (still neutral)
- bear sentiment was up slightly, but still at very low levels (bearish).
In other words, a slight downward bias, rather than a screaming topping signal.
We won’t bet the farm on the short side, but we won’t be chasing prices higher either.
{This section is for paid subscribers only}
We wish our subscribers a profitable week ahead. Please check your email for Trade Alerts.
ANG Traders
Replicate our trades and profits by joining us at www.angtraders.com
Read more by ANGTraders


