
- Gold Surges and Test Resistance
- Historical Volatility is Subdued
- Fed’s Decision is Mixed
Gold prices surged higher during the later part of last week, sharply rebounding mid-week following the Fed’s monetary policy announcement. The Fed’s outlook was carefully analyzed, and it appears that they are more hawkish in 2019-2020, while 2018 will likely be in line with expectations. The market sees the Fed’s short-term forecast of growth and inflation as too optimistic and while short-term rates have moved up, longer-term rates has eased.
The daily chart of gold bullion shows that prices surged last week, recapturing the 10-day moving average which appears to be short-term support near $1,328. A close below this level would lead to a test of the March lows near $1,305. With riskier assets bouncing back, prices will need to close above trend line resistance as well as the January highs near $1,365 to be considered a breakout. The first level of resistance on the yellow metal is seen near a downward sloping trend line near $1,356.
Gold Price Chart
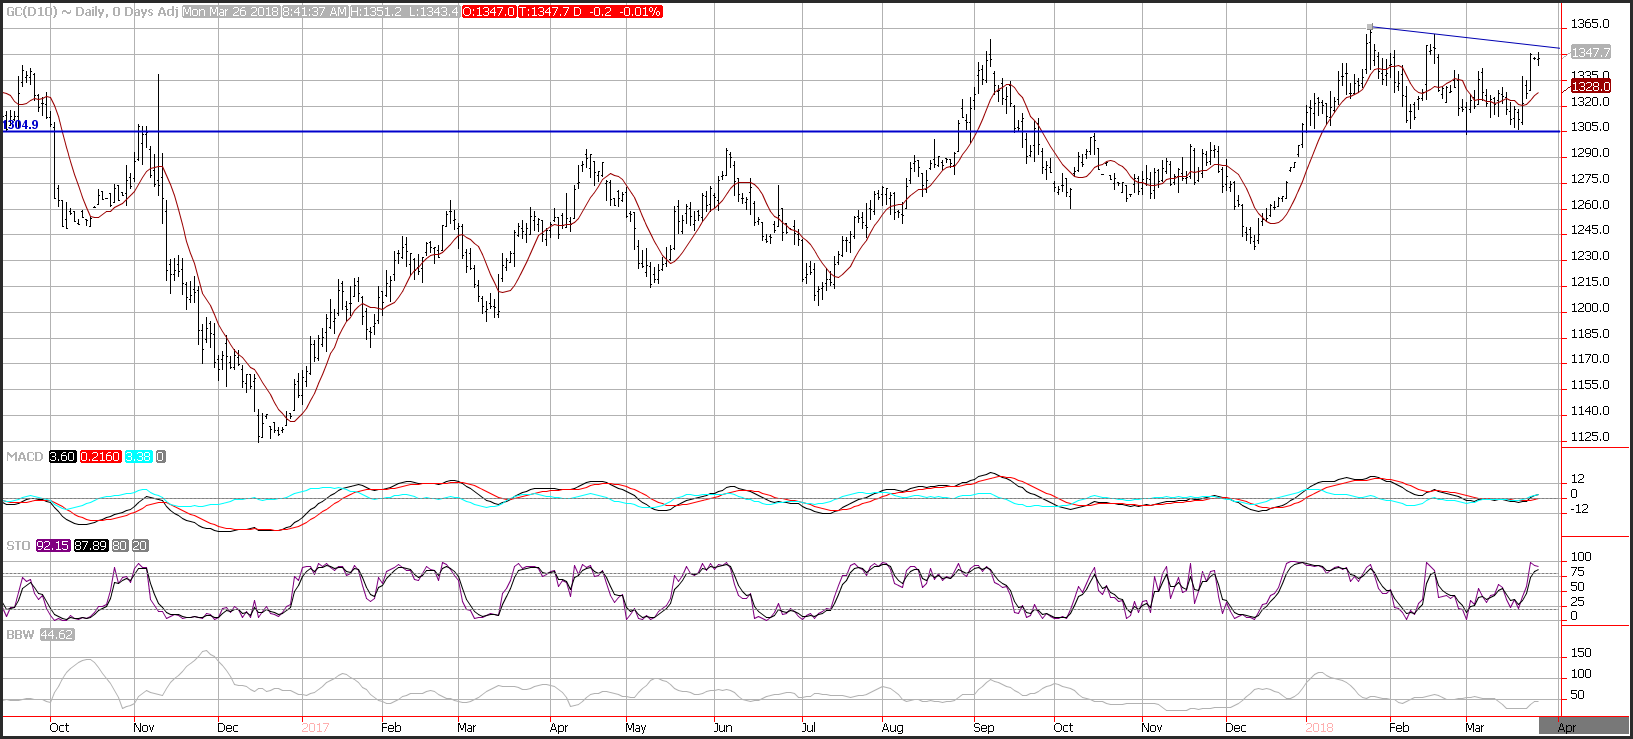
Momentum has turned positive and appears to be whipsawing as prices chop round the current range. The MACD (moving average convergence divergence) index generated a crossover buy signal. This occurs as the MACD line (the 12-day moving average minus the 26-day moving average) crosses above the MACD signal line (the 9-day moving average of the MACD line). The MACD histogram is positive, and the trajectory is upward sloping which reflects positive momentum. The fast stochastic is printing in oversold territory and moving sideways, with a potential crossover sell signal on the horizon. Historical volatility as reflected by the Bollinger band width is near the lowest levels seen in the past 2-years and shows that prices are building up energy and could be poised for a break-out or break-down.
Silver Price Chart
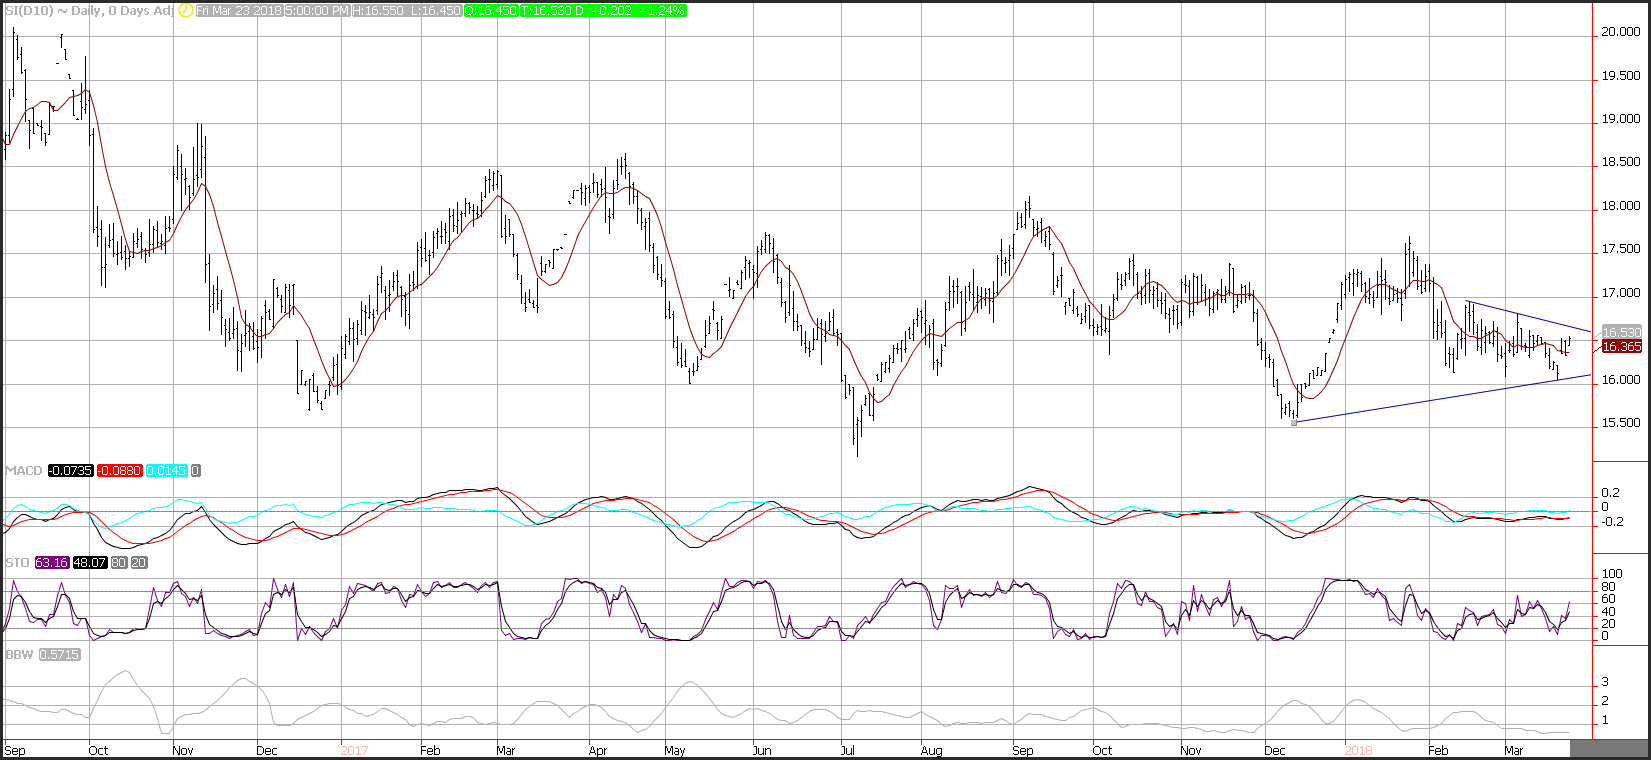
The daily chart of silver bullion shows prices rebound back into a prior range. The consolidation between mid-October and late November allowed volatility to remain subdued. Silver bar prices have been rangebound since December of 2016, last week’s gap higher points to further consolidation.
Support is seen near the 10-day moving average at $16.35, and an upward sloping trend line that comes in near $16.13. Additional support is seen near the March lows at $16.09. Resistance is seen near a downward sloping trend line at $16.65. The MACD (moving average convergence divergence) index, whipsawed generating a crossover buy signal following last week’s crossover sell signal. The fast stochastic which was oversold, last week surged higher as silver prices moved back into the middle of the range. The index is printing a reading of 63, after showing a level of 10, well below the oversold trigger level of 20 last week which foreshadowed a correction. The Bollinger band width is printing near the lowest levels seen in the past 2-years, reflecting very low historical volatility.
Spread Between Gold and Silver Chart
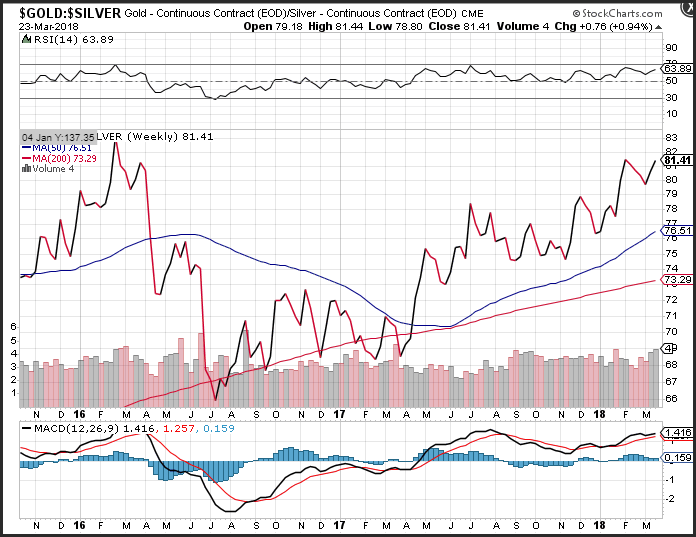
Gold prices outperformed silver in the latest week and is now testing a 2-year high. This tells us that concern outpaced growth, but gold will need to break out for this spread to accelerate higher.
Momentum on the ratio on a weekly basis is positive but flat, as the MACD (moving average convergence divergence) histogram prints in the black with a flattening trajectory which reflects consolidation. The RSI of the ratio edged higher which reflects accelerating positive momentum.
If you believe prices are poised to make a move and you are looking to take advantage of a time to add precious metals to your portfolio, click on this link to get access to your Investment Kit or better yet, give us a call today at 800–982–6105.
Want to read more articles like this? Sign up for our free e-newsletter, and you'll learn when new articles have been published. To see a list of recent articles visit our Treasure Coast Market News page.
Good Investing,
Treasure Coast Bullion Group
Read more by Treasure Coast Bullion Group, Inc - Staff Writer


