
- Gold Slides as the Dollar Gains Traction
- Strong U.S. Data is in Contrast to Weak European Economic Data
- European Sentiment Slides
The stronger greenback last week weighed on gold prices, pushing them down to support as April become the active future contract. At the tail end of last week, U.S. bond yields started to ease, allowing the dollar to pull back which helped buoy gold prices. Traders are now in a waiting game ahead of the February payroll report. Higher than expected wage inflation could be the catalyst that helps gold prices break out.
The daily chart of gold bullion prices shows that prices were able to find support near an upward sloping trend line that comes in near $1,325. A break of this level would lead to a test of the February lows at $1,305. Short-term resistance is seen near the 10-day moving average at $1,338 and then medium-term resistance is seen near a downward sloping trend line that comes in near $1,360. Prices are forming a wedge pattern where energy is building as traders await a breakout or a breakdown.
Gold Price Chart
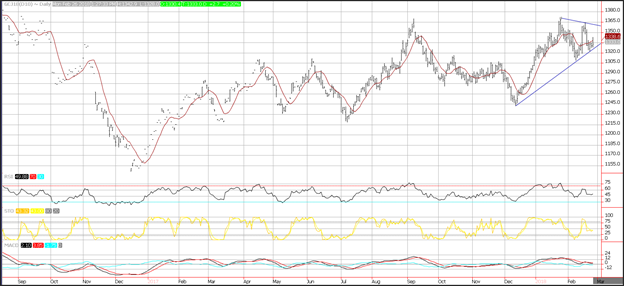
Momentum has turned negative. The MACD line generated a crossover sell signal. The move comes after side-ways price action which means that it could have been formed out of consolidation, and not viewed as a change in momentum. The relative strength index (RSI) moved sideways which also reflects consolidation and this is the same for the fast stochastic which is printing in the middle of the neutral range.
Silver Price Chart
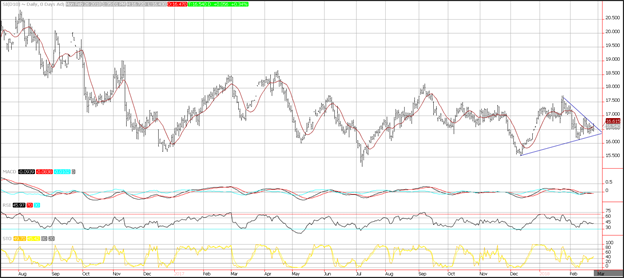
The daily chart of silver bullion shows that prices are hovering in the middle of a large range. Prices are trading slightly below the 10-day moving average at $16.61. Additional resistance is seen near a downward sloping trend line that comes in near Monday’s highs at $16.72. Support is seen near an upward sloping trend line near $16.29. Momentum is neutral. The MACD histogram is printing near the zero-index level with a flat trajectory which reflects consolidation. The relative strength index (RSI) is printing a reading of 46 and moving sideways, which also reflects consolidation. The fast stochastic is printing a reading of 49, moving higher but is in the middle of the neutral range and reflects consolidation.
Spread Between Gold and Silver Chart
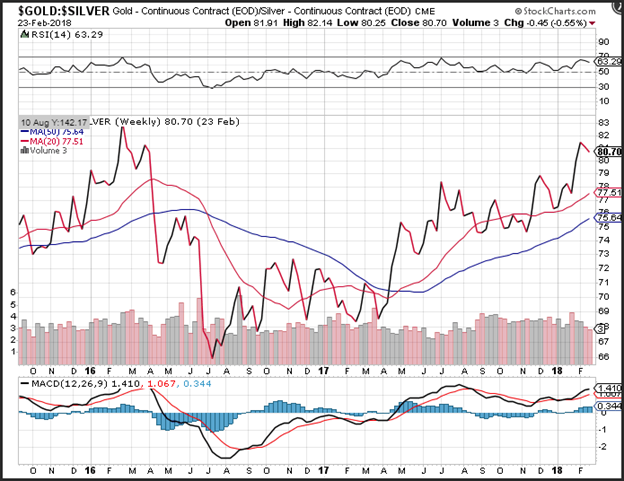
For the second week in a row, silver prices have outperformed gold. After the ratio between gold and silver hit a 23-month high of $81.52, in mid-February silver retraced some of its losses pushing the ratio back to the $80.70 level. As we have mentioned prior, this was a low point for both gold and silver over the past 2-years. The rally in precious metals that ensued following this gold outperformance saw silver climb 53% and gold climb 30%.
Momentum on the ratio on a weekly basis has turned positive, but the recent outperformance of silver has pushed weighed on the trajectory of the MACD which reflects consolidation. The RSI of the ration appears to be declining after making a move toward the overbought trigger level of 70 just 3-weeks ago.
If you are looking to take advantage of a time to add precious metals to your portfolio, click on this link to get access to your Investment Kit or better yet, give us a call today at 800–982–6105.
Good Investing
Read more by Treasure Coast Bullion Group, Inc - Staff Writer


