After surging higher on Valentine’s Day in the wake of a hotter than expected CPI report, gold prices have consolidated and have formed a bull flag pattern. This is a pause that refreshes higher, and accelerates on an upside breakout. The rebound in stock prices did not seem to effect gold prices, but the surge in bond yields are helping the dollar gain traction which is weighing on gold bar prices.
The daily chart of gold bullion prices shows consolidation as the yellow metal was unable to push through resistance near the $1,365 level which coincided with the May 2017 highs, as well as the 38% weekly Fibonacci retracement level. Support is seen near the 10-day moving average near $1,332. There is additional support which is an upward sloping trend line that connects the low in December to the lows in February and comes in near $1,325.
Gold Price Chart
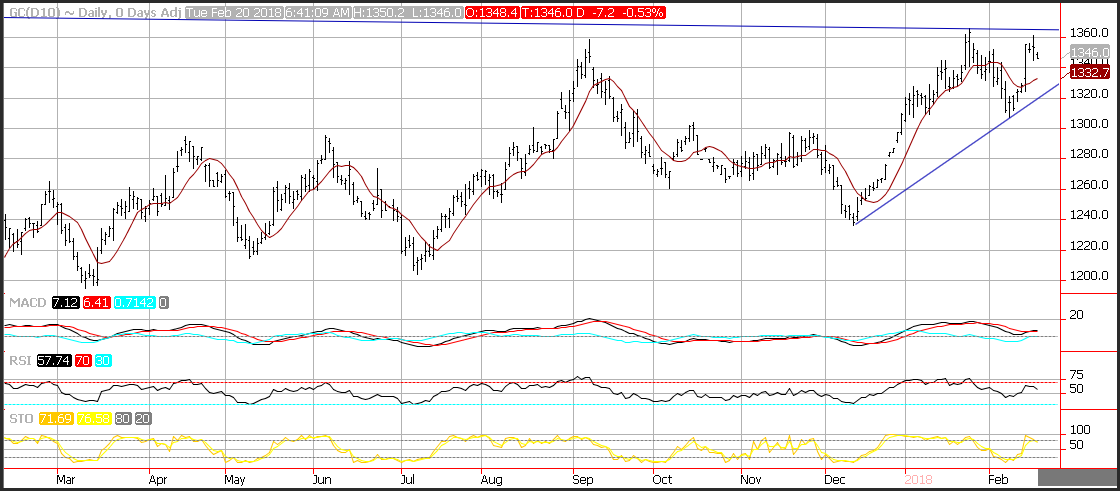
Momentum is now neutral. The MACD histogram is now printing near the zero-index level with a flat trajectory which points to consolidation. The relative strength index (RSI) has formed a triple top and edged lower reflecting decelerating positive momentum. The current reading of 57, reflects consolidation. The fast stochastic has dropped from overbought territory and is printing a reading of 71, which is in the upper end of the neutral range and also reflects consolidation. A break out above 1,365 would likely refresh positive momentum.
Silver Price Chart
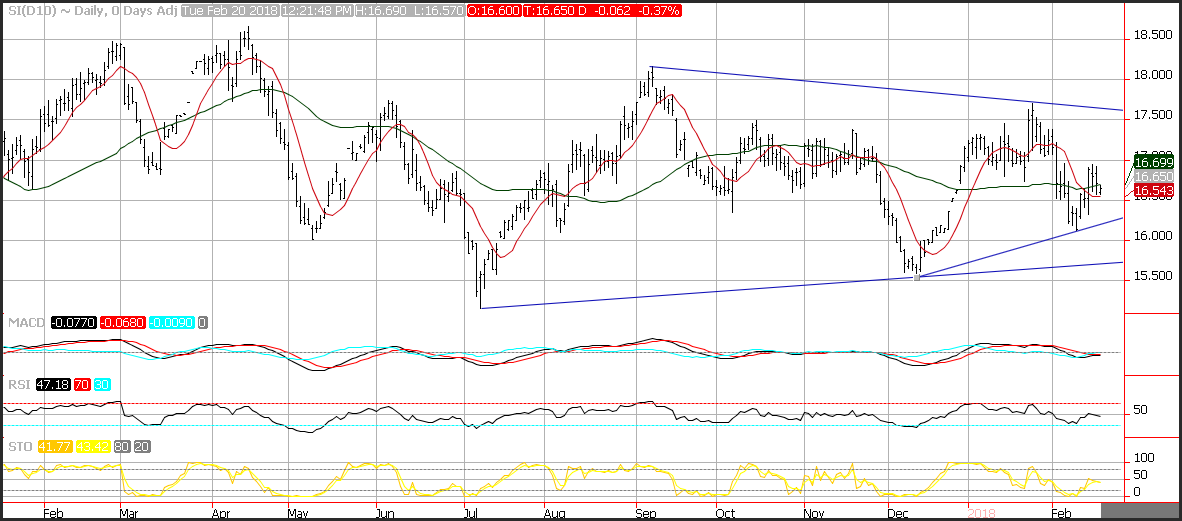
The daily chart of silver bullion shows that prices are hovering in the middle of a large range. Prices are sandwiched between the 10-day moving average at $16.54 and the 50-day moving average at $16.65. Additional support is seen near an upward sloping trend line near $16.25. Momentum is neutral. The MACD is poised to generate a buy signal, but this is more of a function of decelerating negative momentum. The relative strength index (RSI) is printing a reading of 47, which is in the middle of the neutral range and reflects consolidation. The fast stochastic is printing a reading of 42, which is also in the middle of the neutral range and reflects consolidation.
Spread Between Gold and Silver Chart
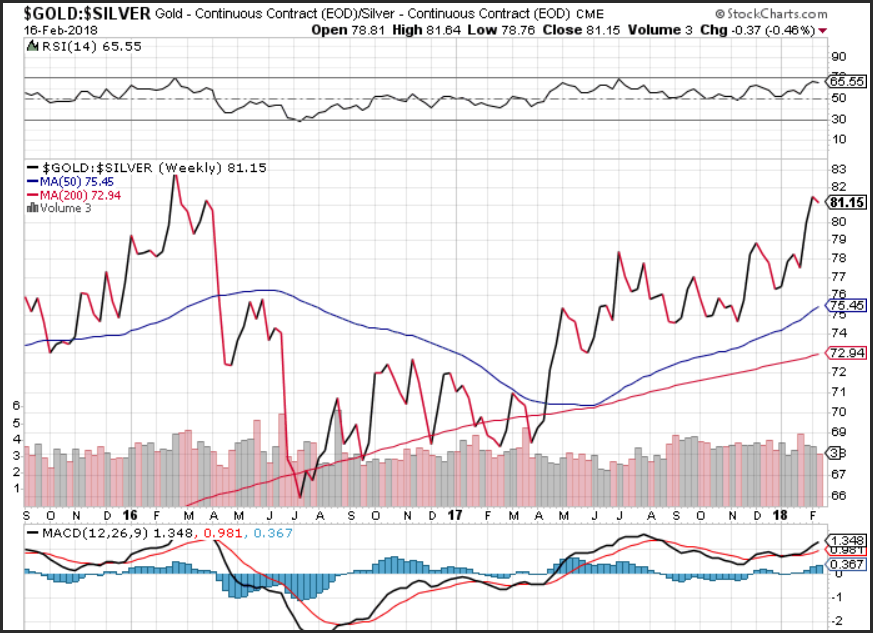
Gold prices rebounded relative to silver in the middle of last week, but are lower on a week over week basis. After the ratio between gold and silver hit a 23-month high of $81.52, silver retraced some of its losses pushing the ratio back to the $81.15 level. As we have mentioned prior, this was a low point for both gold and silver over the past 2-years. The rally in precious metals that ensued following this gold outperformance saw silver climb 53% and gold climb 30%.
Momentum on the ratio on a weekly basis has turned positive as the MACD (moving average convergence divergence) generated a crossover buy signal. This occurs as the MACD line (the 12-week moving average minus the 26-week moving average) crosses below the MACD signal line (the 9-week moving average of the MACD line). The MACD histogram is now printing in the black with an upward sloping trajectory which points to gold outperforming silver. As the ratio reaches an RSI reading of 70, the spread will likely top out.
If you are looking to take advantage of a time to add precious metals to your portfolio, click on this link to get access to your Investment Kit or better yet, give us a call today at 800–982–6105.
Good Investing,
Treasure Coast Bullion Group
Read more by Treasure Coast Bullion Group, Inc - Staff Writer