
Another Tax Day has come and gone. This was the first year that Americans paid taxes under President Donald Trump’s tax cuts. And yet many filers—especially those living in high income tax states such as New York, California and New Jersey—saw their payments rise significantly due to state and local tax (SALT) deductions being capped at $10,000.
This change has been a boon for municipal bonds, which are exempt from taxes not only at the federal level but also, in most cases, state and local levels.
Muni bond funds, in fact, just had their best quarter of inflows since 2009, as you can see below.
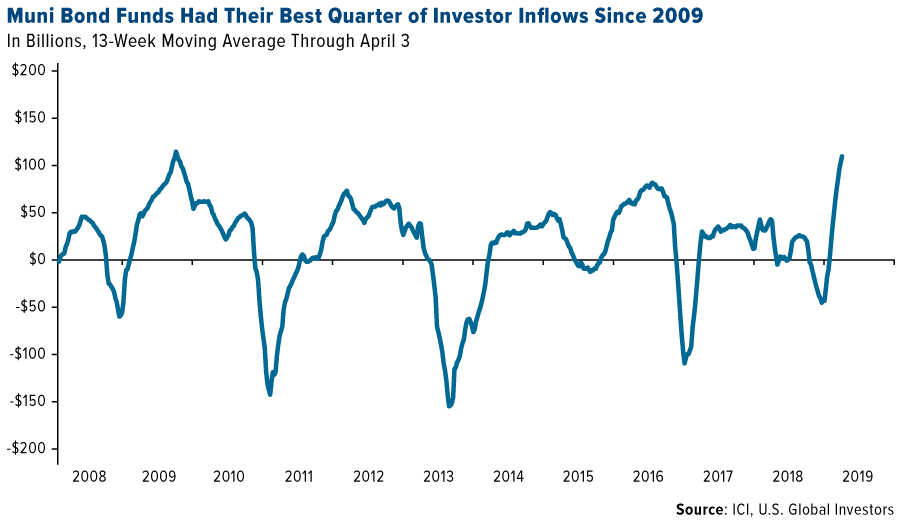
According to Morningstar data, tax-free muni bonds saw more than $8.8 billion in net flows in the three months ended March 31, beating U.S. equity funds ($6.2 billion) and international equity funds ($1.3 billion). This tells me that investors were seeking stability as well as a strategy to counteract the changes to the tax code.
Investors Prefer Actively Managed Muni Bond Funds
Actively managed muni funds were more popular than passively managed funds, including ETFs. Active funds attracted $7.5 billion, more than five and a half times more than passive muni funds, which saw only $1.3 billion in net flows, according to Morningstar.
I think the reason investors prefer active muni funds is that they want a manager who knows how to conduct deep credit research, adjust for duration and monitor for risks and opportunities. You don’t get that with a passive fund.
Muni Supply Has Tightened
Trump’s tax law supports the outlook for muni demand in more ways than one. The supply of municipal debt has been restricted thanks to the elimination of a category known as “advanced refunding issues,” which in years past accounted for about a fifth of muni bond issuances annually.
Any casual student of economics knows that tighter supply, combined with increased demand, creates investment opportunities. And since the tax law went into effect in January 2018, muni bonds have outperformed both 10-year Treasuries and investment-grade corporate debt.
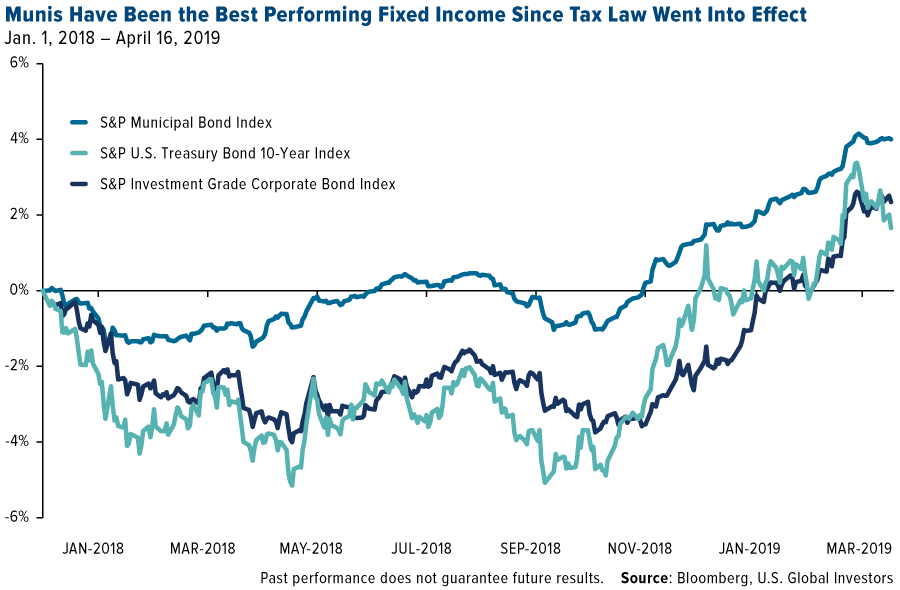
On a final note, I should point out that munis have a history of doing well in late-cycle environments, which we seem to be in right now. This, along with flat issuance and stronger demand for tax-free income, should help the asset class remain resilient throughout the year and beyond.
Gold “Lives Up to the Hype”
Another asset whose supply is forecast to tighten in the coming years is gold, due mainly to shrinking exploration budgets and the lack of large discoveries. As I told Streetwise Reports last week, the gold mining industry hasn’t seen any technological breakthroughs as there have been in oil and gas with fracking.
Also like munis, demand for the yellow metal remains strong and should continue to strengthen as incomes grow in emerging markets such as China, India and Turkey.
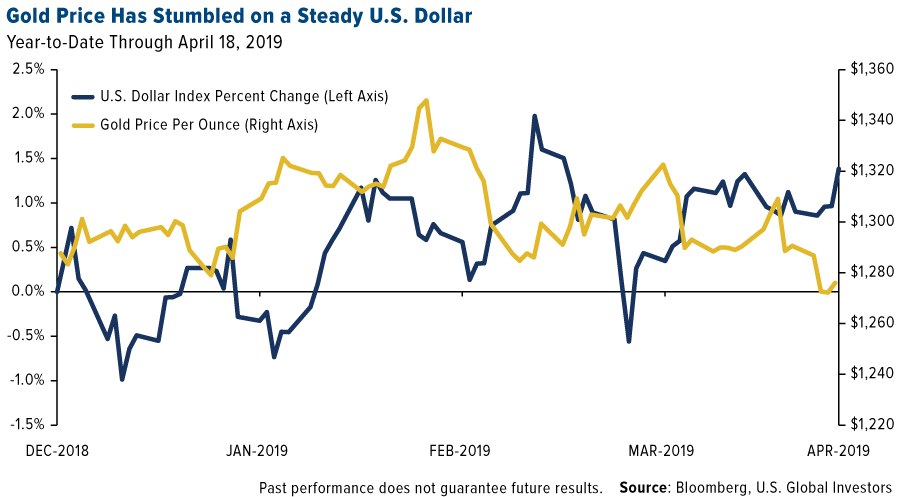
Last week, the price of gold fell to a 2019 low of around $1,270 an ounce as the 10-year Treasury yield ticked up and U.S. dollar stayed at elevated levels.
Nevertheless, some analysts continue to see this as an “extremely attractive environment,” in the words of British banking firm Standard Chartered.
“We are very constructive on gold, both within our strategy teams and within our commodity research teams,” Standard Chartered’s Eric Robertson told Bloomberg. “Even with the recovery that we’ve seen in equity prices and nominal bond yields over the last few weeks, real or inflation-adjusted yields remain extremely low. And that’s a better indicator for gold.”
In a report last week titled “Gold lives up to the hype as a safe haven,” research firm Capital Economics said it sees gold rallying to $1,400 an ounce or more by mid-2019 on equity weakness.
“Given that we expect the S&P 500 to drop by roughly a fifth this year, we think gold’s safe-haven credentials will soon come to the fore again,” says commodities economist Ross Strachan, who goes on to explain that in seven out of eight times since 1990 in which the S&P declined more than 10 percent over a prolonged period, the price of gold rose 7.2 percent on average.
Venezuela’s $400 Million Sale Weighed on Gold
Gold traded down following the news on Monday that Venezuela sold as much as $400 million of the metal, the South American country’s only remaining liquid asset. This comes after Venezuela opposition leader Juan Guaido in February urged the U.K. not to send cash to President Nicolas Madura upon sale of the country’s gold reserves, held in the Bank of England’s (BoE) vaults.
The recent sale could mean that President Maduro has found a way to sidestep sanctions, according to Bloomberg.
The report also points out that Venezuela’s central bank “has been operating with what it calls an emergency team of only about 100 workers of about 2,000 since a power outage left its headquarters without running water.” What Maduro has done to this once prosperous country and its people is nothing short of tragic.
In any case, the gold market should stabilize once Venezuela is done selling this quarter.
--
All opinions expressed and data provided are subject to change without notice. Some of these opinions may not be appropriate to every investor. Some links above may be directed to third-party websites. U.S. Global Investors does not endorse all information supplied by these websites and is not responsible for their content.
The S&P Municipal Bond Index is a broad, market value-weighted index that seeks to measure the performance of the U.S. municipal bond market. The S&P U.S. Treasury Bond Current 10-Year Index is a one-security index comprising the most recently issued 10-year U.S. Treasury note or bond. The S&P 500 Investment Grade Corporate Bond Index, a sub-index of the S&P 500 Bond Index, seeks to measure the performance of U.S. corporate debt issued by constituents in the S&P 500 with an investment-grade rating. The U.S. Dollar Index is an index of the value of the United States dollar relative to a basket of foreign currencies, often referred to as a basket of U.S. trade partners' currencies. The S&P 500 Index is a float-adjusted market-cap weighted index. It's calculated by taking the sum of the adjusted market capitalization of all S&P 500 stocks and then dividing it with an index divisor, which is a proprietary figure developed by Standard & Poor's.
U.S. Global Investors, Inc. is an investment adviser registered with the Securities and Exchange Commission ("SEC"). This does not mean that we are sponsored, recommended, or approved by the SEC, or that our abilities or qualifications in any respect have been passed upon by the SEC or any officer of the SEC. This commentary should not be considered a solicitation or offering of any investment product. Certain materials in this commentary may contain dated information. The information provided was current at the time of publication.
Read more by Frank Holmes


