
- Gold and Silver Surge but Remain Range bound.
- Positive Momentum is Accelerating.
- Trade Splat with China Drives Safe Haven Assets
Gold prices rebounded early on Monday following a long holiday weekend. Prices appear to be buoyed by news that the Chinese government has increased the number of items that are now expected to receive tariffs. China has increased tariffs by up to 25% on 128 U.S. products, from frozen pork to certain fruits and nuts, escalating the standoff between the world’s biggest economies in response to U.S. duties on imports of aluminum and steel. China’s Ministry of Commerce said it was suspending its obligations to the World Trade Organization to reduce tariffs on 120 U.S. goods.
The daily chart of gold bullion shows that prices reversed last weeks late slide on Monday and bounced to the middle of the current range. Gold bullion was able to recapture the 10-day moving average at $1,330. Additional support on the yellow metal is seen near an upward sloping trend line that connects the lows in December to the lows in March and comes in near $1,310. Resistance is seen near a downward sloping trend line that comes in near $1,348. Prices continue to move sideways, as they store energy waiting for a catalyst that will drive a breakout or a break down.
Gold Price Chart
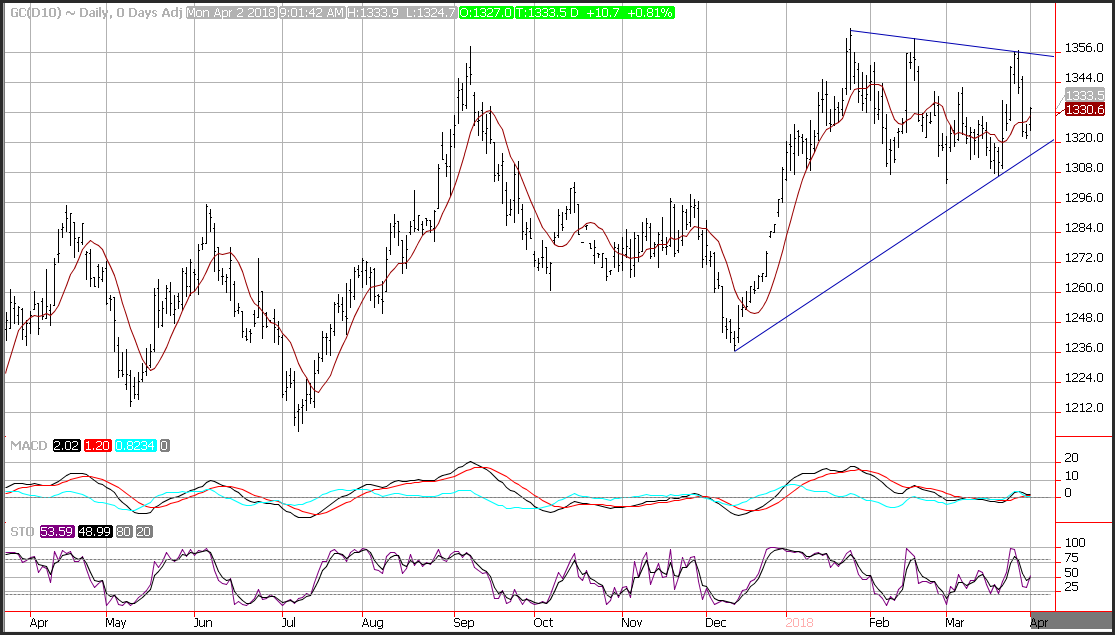
Momentum is neutral as prices whipsaw in the current reading. The MACD (moving average convergence divergence) index is printing near the zero-index level. The MACD histogram is positive, and the trajectory is flat which reflects consolidation. The fast stochastic generated a crossover buy signal which reflects the short-term pop in prices. Historical volatility as reflected by the Bollinger band width is near the lowest levels seen in the past 2-years and shows that prices are building up energy.
Silver Price Chart
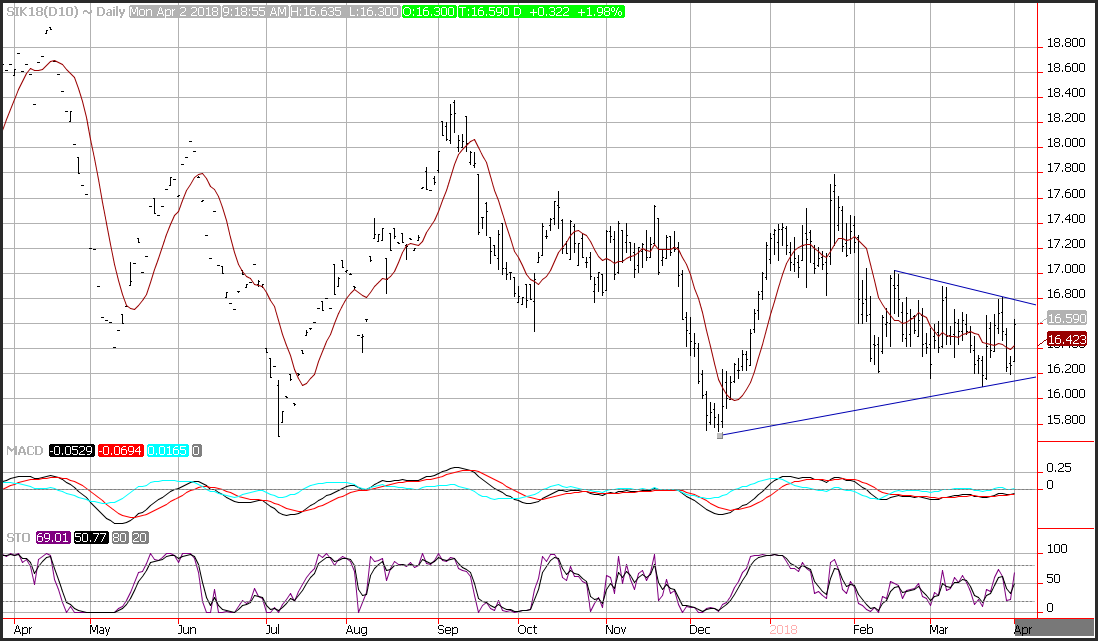
The daily chart of silver bullion shows prices also remain range bound despite the 2% climb early on Monday. The most recent commitment of trader’s report released for the date ending March 27, 2018 shows that managed money remains short, silver. The current open interest reflects that hedge funds are short more than double the number of contracts that they are long. Managed money is short 66K contracts versus a long position of 32K contracts of futures and options. This could lead to a robust short-squeeze if prices can pierce through resistance. The consolidation between mid-October and late November has allowed volatility to remain subdued.
Support is seen near the 10-day moving average at $16.42, and an upward sloping trend line that comes in near $16.19. Resistance is seen near a downward sloping trend line that comes in near $16.79. The MACD (moving average convergence divergence) index, whipsawed generating a crossover buy signal following last week’s crossover sell signal. The fast stochastic generated a crossover buy signal which points to accelerating positive momentum.
Spread Between Gold and Silver Chart
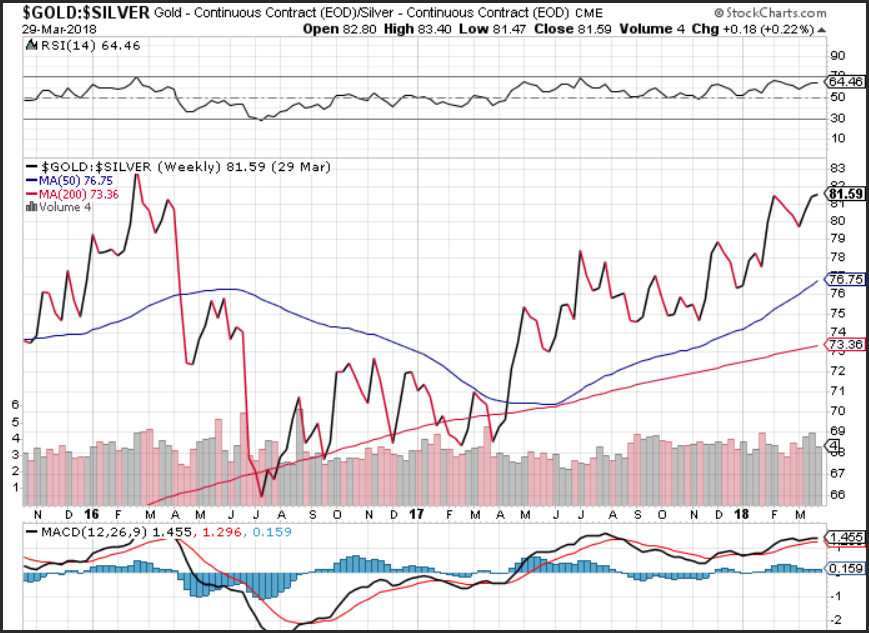
Gold prices outperformed silver in the latest week but Monday’s early rally could reverse this weekly trend. This tells us that concerns about trade are allowing silver to outperform.
Momentum on the ratio on a weekly basis is positive but flat, as the MACD (moving average convergence divergence) histogram prints in the black with a flattening trajectory which reflects consolidation. The RSI of the ratio edged higher which reflects accelerating positive momentum.
If you are looking to take advantage of a time to add precious metals to your portfolio, click on this link to get access to your Investment Kit or better yet, give us a call today at 800–982–6105.
Want to read more articles like this? Sign up for our free e-newsletter, and you'll learn when new articles have been published. To see a list of recent articles visit our Treasure Coast Market News page.
Good Investing,
Treasure Coast Bullion Group
Read more by Treasure Coast Bullion Group, Inc - Staff Writer


