The broad stock market fluctuated within a short-term consolidation range yesterday following Tuesday's decline. Is this a topping pattern before another leg down or just some relatively flat correction within a new uptrend?
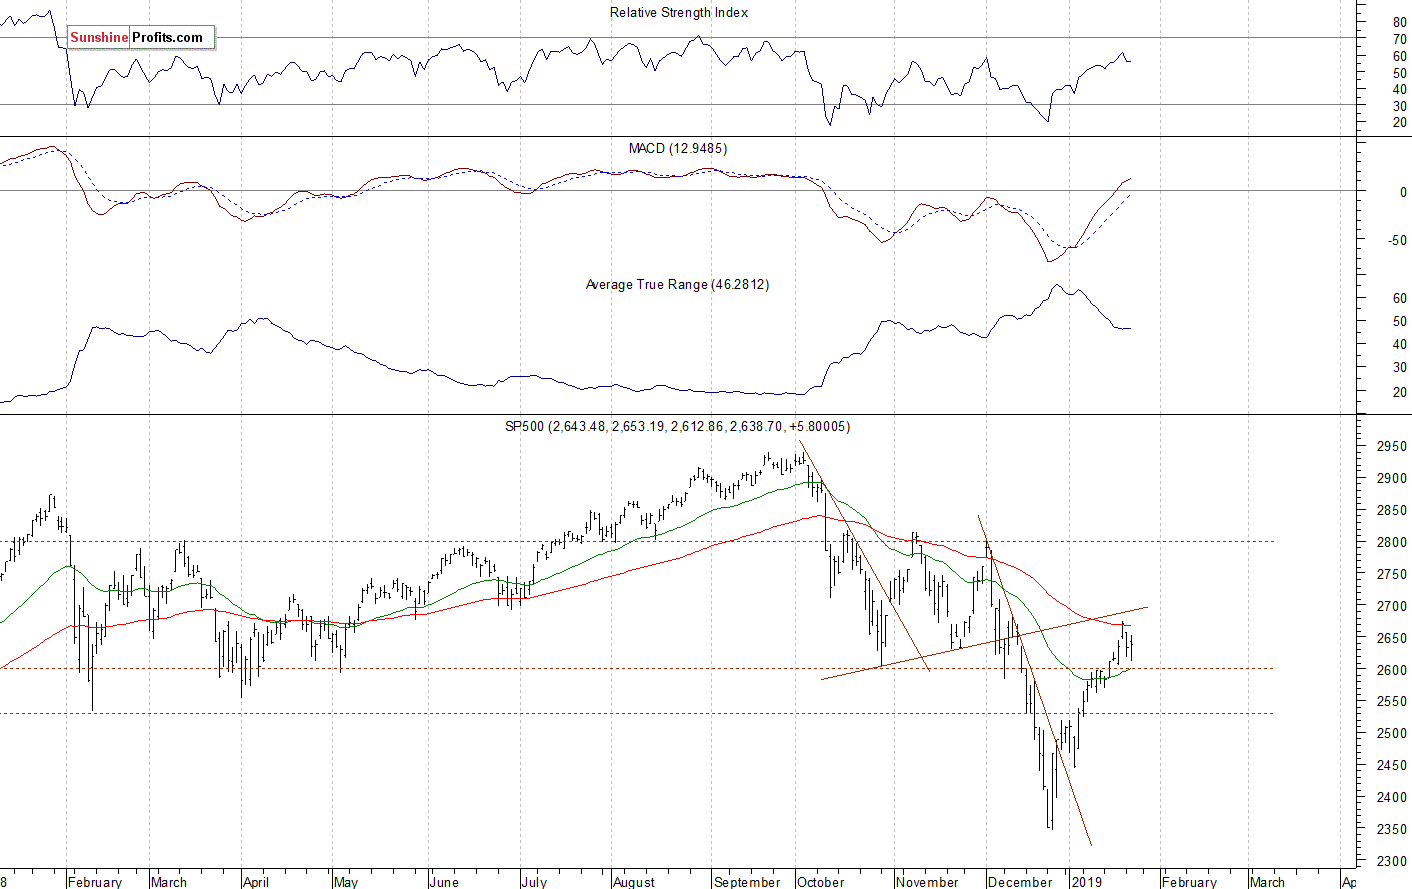
The U.S. stock market indexes gained 0.1-0.7% on Wednesday, as they fluctuated following Tuesday's decline. The S&P 500 index continued its rebound off the December t26th medium-term low of 2,346.58. The index traded 20.2% below the September 21st record high of 2,940.91 on that day. Then the market rallied and retraced more than 50% of the move down (at 2,643.74). It broke slightly above the 2,600 mark last week and it got closer to 2,700 on Friday. The Dow Jones Industrial Average gained 0.7% and the Nasdaq Composite gained 0.1% yesterday.
The nearest important resistance level of the S&P 500 index remains at 2,675-2,685, marked by the early December local highs. The resistance level is also at 2,700-2,710. On the other hand, the support level is at around 2,600-2,610. The support level is also at 2,570-2,585, marked by some recent local lows.
The broad stock market broke below its two-month-long trading range in mid-December, as the S&P 500 index fell below the level of 2,600. Then the market accelerated lower and it broke below the 2,400 mark. The downward correction reached 20.2% from the September all-time high, surpassing the January-February correction of around 12%. Since then, the market has retraced more than 50% of the whole decline off the September high. The index trades close to a possible resistance level of its previously broken upward trend line, as we can see on the daily chart:
Short-Term Consolidation
The index futures contracts trade 0.1-0.5% above their Wednesday's closing prices. So expectations before the opening of today's trading session are slightly positive. The European stock market indexes have been mixed so far. Investors will wait for a series of economic data announcements today: Initial Claims at 8:30 a.m., Flash Manufacturing PMI, Flash Services PMI at 9:45 a.m., Leading Indicators at 10:00 a.m., Crude Oil Inventories at 10:30 a.m. They will also wait for more quarterly corporate earnings releases. The broad stock market will likely fluctuate following the recent advance and its Tuesday's downward correction. There have been no confirmed negative signals so far. But we saw some clear short-term technical overbought conditions recently.
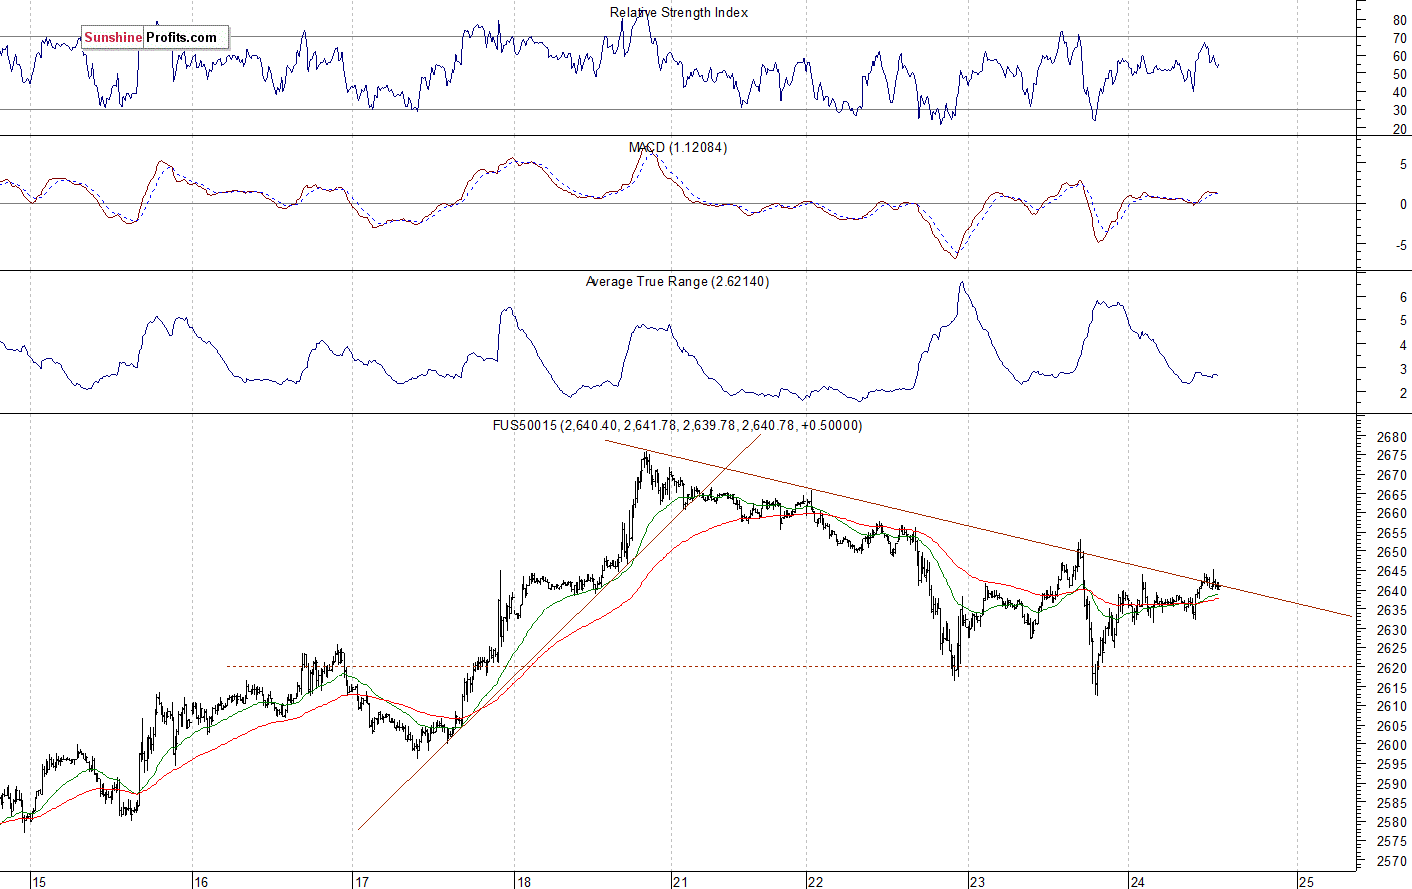
The S&P 500 futures contract trades within an intraday consolidation, as it fluctuates following yesterday's rebound. The nearest important resistance level remains at around 2,640-2,650, marked by the recent fluctuations. The resistance level is also at 2,660-2,670. On the other hand, the support level is at 2,615-2,620, marked by the local lows. The futures contract continues to trade along its short-term downward trend line, as the 15-minute chart shows:
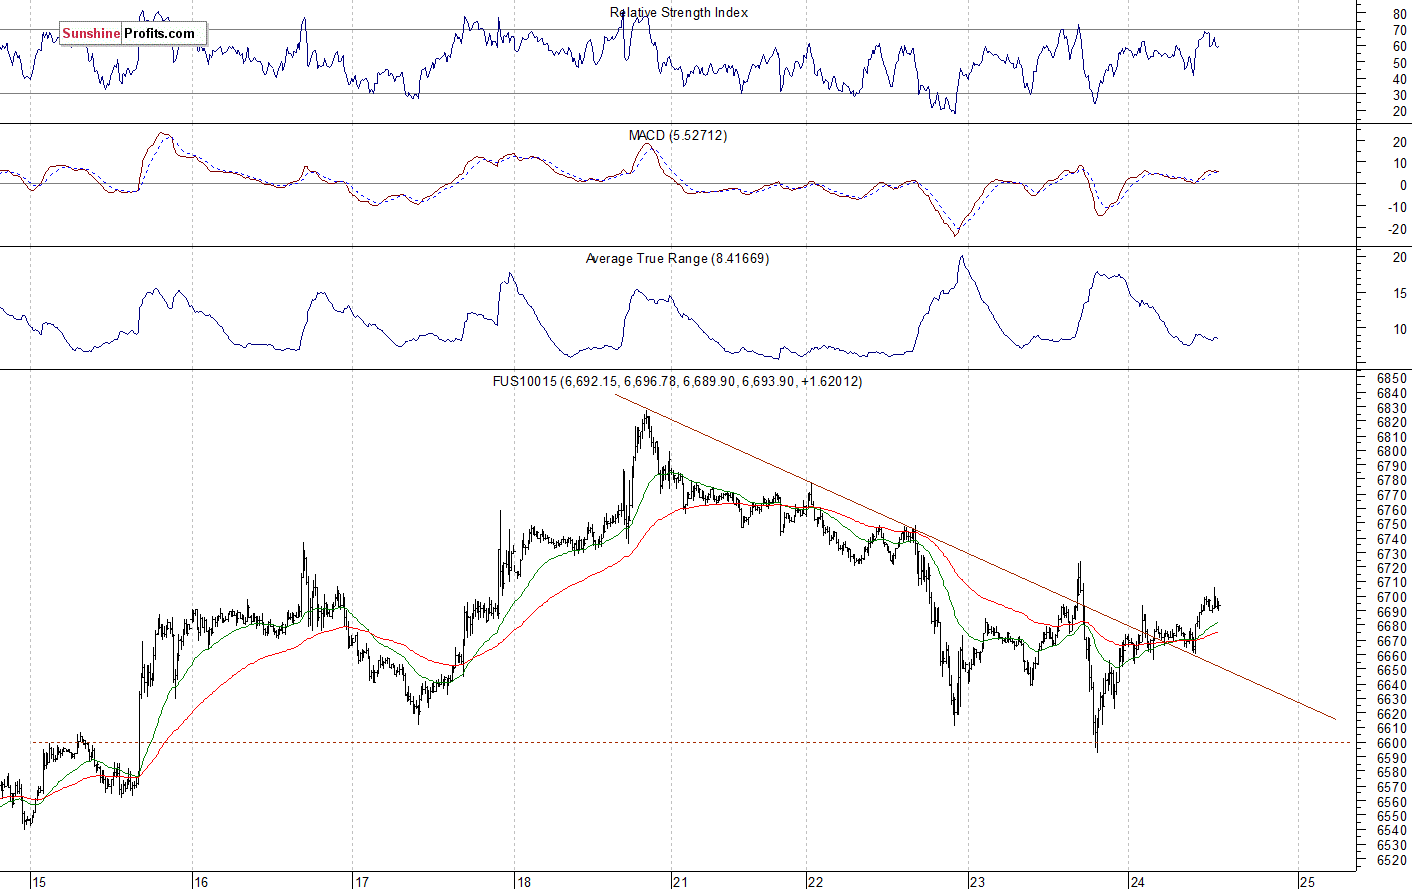
Nasdaq Continues Sideways
The technology Nasdaq 100 futures contract follows a similar path, as it trades within an intraday consolidation after yesterday's advance and a rebound off the 6,600 mark. The market gained over 1,000 points from December 26th local low of around 5,820. On Friday it broke above the 6,800 mark before quickly reversing lower. The nearest important resistance level remains at 6,700-6,750. The next resistance level is at 6,800-6,830. The support level is at 6,600-6,650, among others. The Nasdaq futures contract remains close to the level of 6,700 this morning, as we can see on the 15-minute chart:
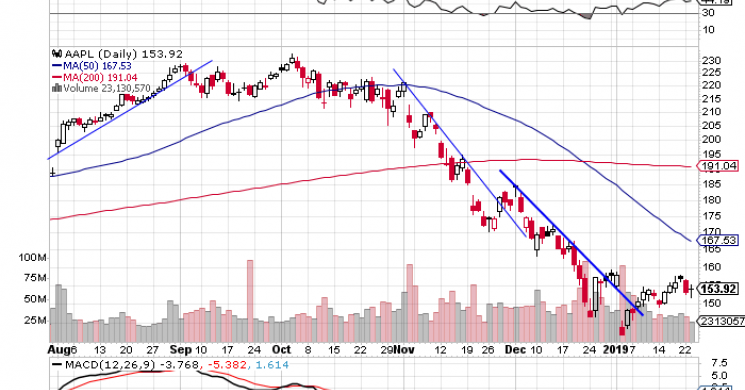
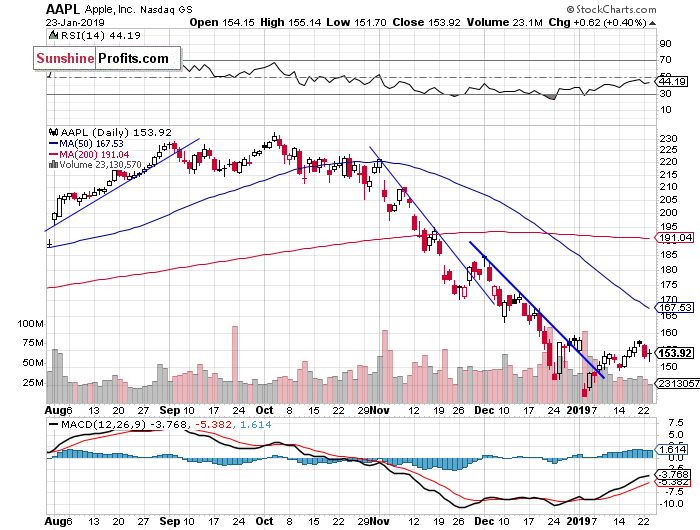
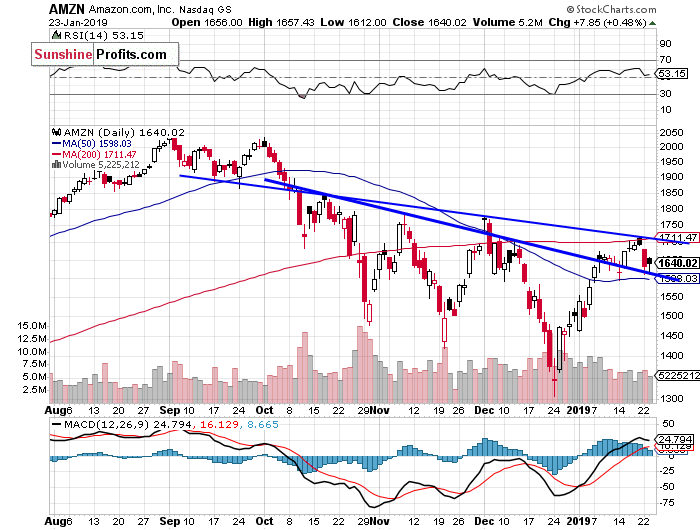
Apple, Amazon - Flat Corrections?
Let's take a look at the Apple, Inc. stock (AAPL) daily chart (chart courtesy of http://stockcharts.com). The stock sold off in early January, as it reached the new medium-term low of $142. We saw clear short-term oversold conditions and then the stock retraced some of its recent decline. It broke above the month-long downward trend line, but it still trades at the resistance level of $155-160:
Now let's take a look at the daily chart of Amazon.com, Inc.(AMZN). The stock accelerated its downtrend in late December and it reached a new medium-term low of $1,307. Since then it has been consequently advancing. The market broke above one of its three-month-long downward trend lines. There is a close resistance level at around $1,700-1,750, and the stock retraced its recent run-up recently:
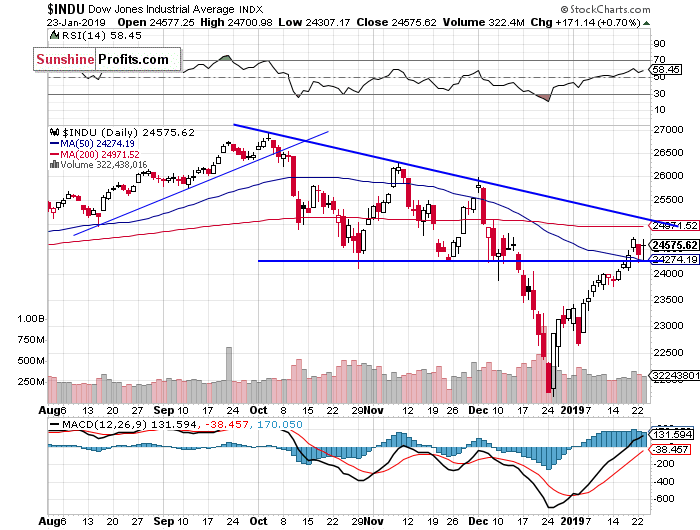
Blue-Chip Stocks Close to Local Highs
The Dow Jones Industrial Average broke above the level of 24,000 last week, and it continued higher towards the 25,000 mark on Friday. The market is back above its October-December local lows. So will it continue higher and reach the record high again? For now, it still looks like an upward correction. However, there have been no confirmed negative signals so far. The resistance level remains at the mentioned 25,000 level:
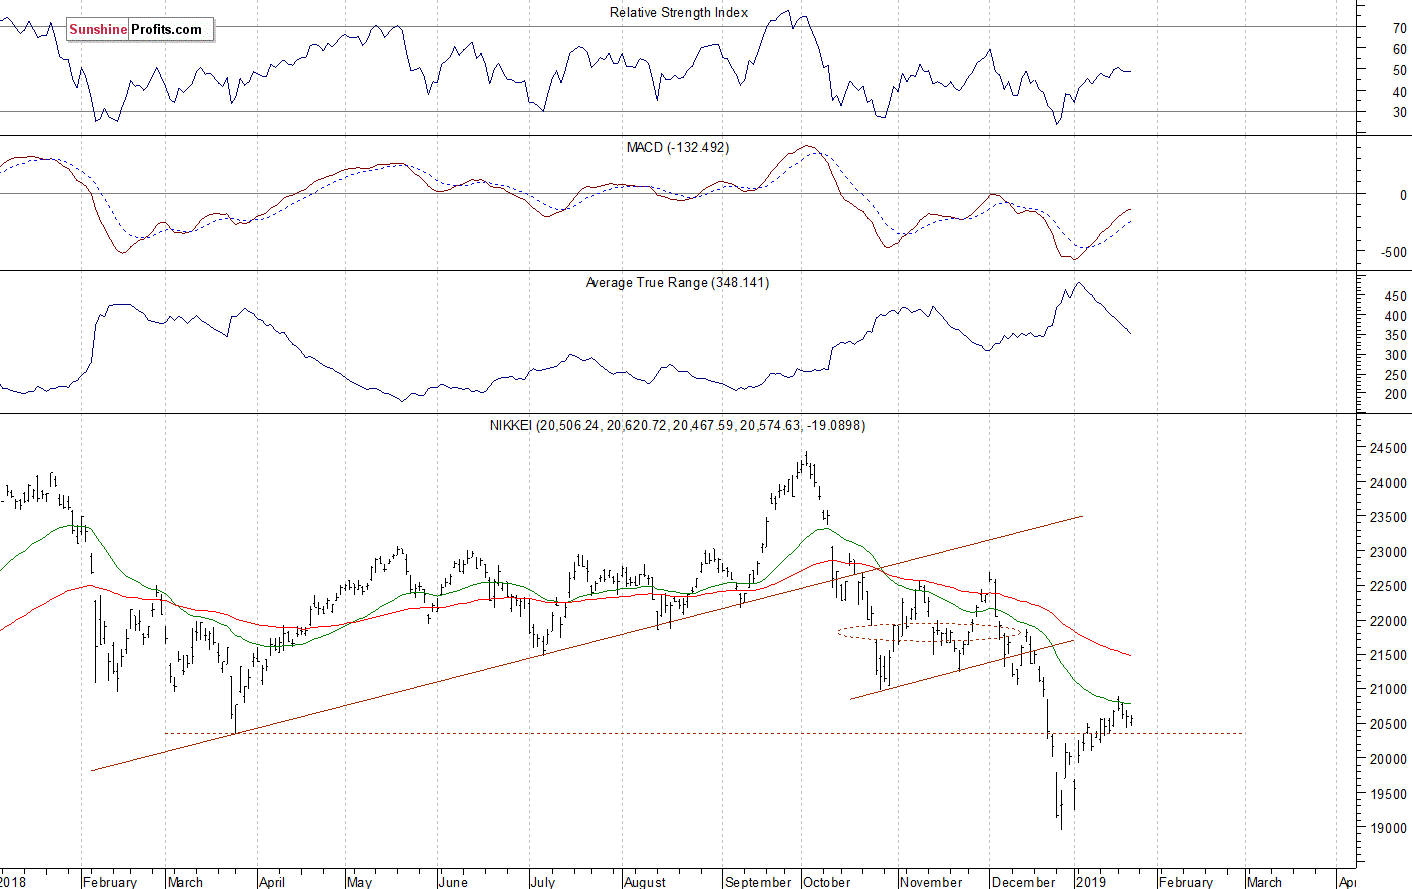
Japanese Nikkei Remains Relatively Weaker
Let's take a look at the Japanese Nikkei 225 index. It accelerated the downtrend in late December as it fell slightly below the level of 19,000. Since then it has been retracing the downtrend. Recently we saw an advance above the level of 20,000. For now, it still looks like an upward correction and the Nikkei remains relatively weak, as it remains way below the October - November local lows:
The S&P 500 index extended its short-term uptrend recently, as it broke above the mentioned 50% retracement of the whole downtrend from the record high. Is this a new medium-term uptrend? We can see a short-term downward correction. However, the medium-term picture is quite bullish at this moment.
Concluding, the S&P 500 index will likely open slightly higher today and then we may see some more short-term fluctuations. For now, it looks like a correction within an uptrend.
If you enjoyed the above analysis and would like to receive free follow-ups, we encourage you to sign up for our daily newsletter – it’s free and if you don’t like it, you can unsubscribe with just 2 clicks. If you sign up today, you’ll also get 7 days of free access to our premium daily Gold & Silver Trading Alerts. Sign up today!
Thank you.
Paul Rejczak Stock Trading Strategist Stock Trading Alerts Sunshine Profits - Free Stock Market Analysis
Read more by MarketSlant Editor


