Summary:
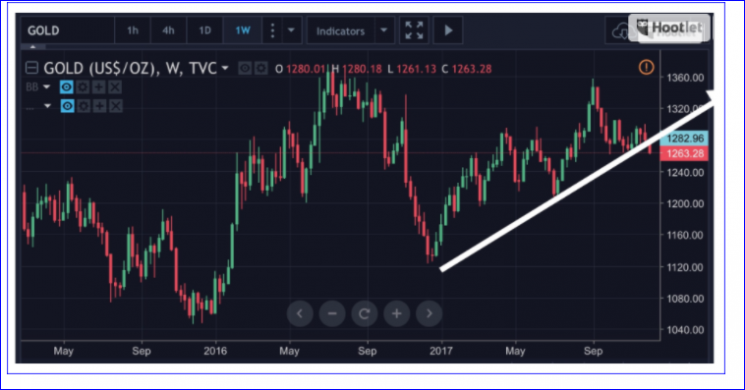
- Below a weekly trendline that came in at $1273 area we have seen $27 sell off of a potential $97 drop
- Back above that weekly trendline will negate downside momentum
- Serious macro upward movement will be reignited if the weekly line is pierced going up and has enough momentum to hit $1303
- A break of $1303 will reignite a measured move of between $172 and $490 higher
The weekly Break down chart from this post

via Moor Analytics
On a short-term basis:
There is a steep minor line coming in at 12554-61 (-3 tics (30 cents) per/hour starting at 8:20am), a break above which will warn of short covering, but if we break above here and back below, look for profit taking to come in (this doesn’t need a decent break, but something more than a short term break).
On a macro basis:
We broke above a well-formed macro line in the week of 8/7 that came in at 12629. The break above here projects this upward $172 minimum, $491 (+) maximum—the maximum to be attained likely within 9-12 months. However, this has been on hold since we broke below the formation mentioned below. This line will come in at 12273 this week. Solid failure below it will warn of significant pressure in the weeks ahead. The solid trade below 12736-33 projects this downward $19 minimum, $97 (+) maximum based off a well-formed formation. We have seen $27.4 so far. This will come in at 12740 today. If we break back above solidly, look for solid short covering to come in, likely back toward 13030 (+); and a resumption of the macro bull call.
For daily subscription reports email Michael
Read more by Soren K.Group


