Gold Today
Some content courtesy of Moor Analytics
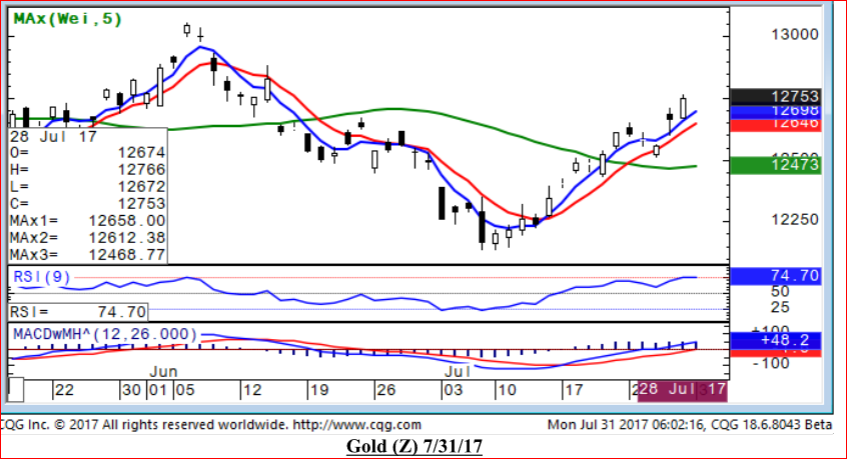
We remain in a bull leg with a settlement below $1260.70 (December Futures) being a trigger for likely continued declines.
Rallies to Sell
There was some profit taking in the $1274 area. The market so far has absorbed it. Be aware of strong longs selling to new, weaker longs now. If O.I. flatlines in another leg up, that is the cue to be careful as the "strong hands to weak hands" rotation may be taking hold
After that $1294-97. Any break above these areas is good for continuation. But a break back below after piercing will likely cause more aggressive, almost panicked liquidation. Some selling would be by longs with nice profits to book, others from short term momentum stop-losses placed after getting long on initial piercing that area.
Dips to Buy
Day traders will likely buy in the $1271 area with tight stops. There is a rising trendline coming in at $1260.70 on the hourly this opening to be bought first time down. Underneath that there are plenty of places to buy and reverse if broken through.
Keep in mind a settle below $1260.70 likely not only negates the current bull run, but starts a bear leg.
For subscription info:
- Email: Michael Moor
- Call: 646-708-4612
Friday's Volatility Based System (VBS) Trade
From Friday's Post
- Long above $1259 (filled at $1260) looking for $10.00 in 2 days = $1270 target
- Stop-loss at $1257 - making the risk reward 3 to 1 per our VBS system
- Do not take the trade home if settles Out of the money. So if settles under our buy level but not stopped out, we exit. This is a device we implemented and improved upon specifically to protect against thinly traded overnight spoofers who would most certainly stop us out
- If target reached sell half of position and trail the stop up to $1265 on the rest with the next target as $1283
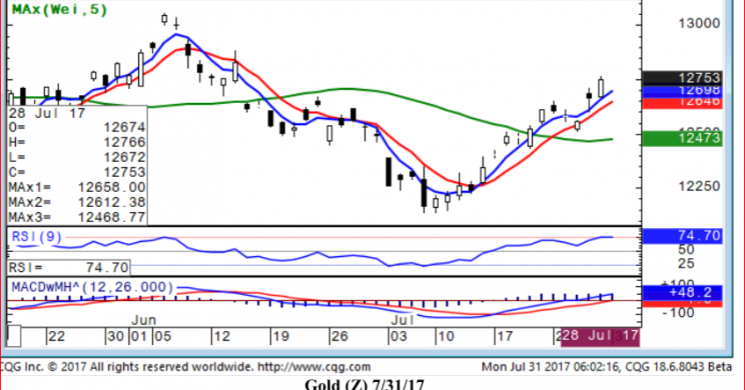
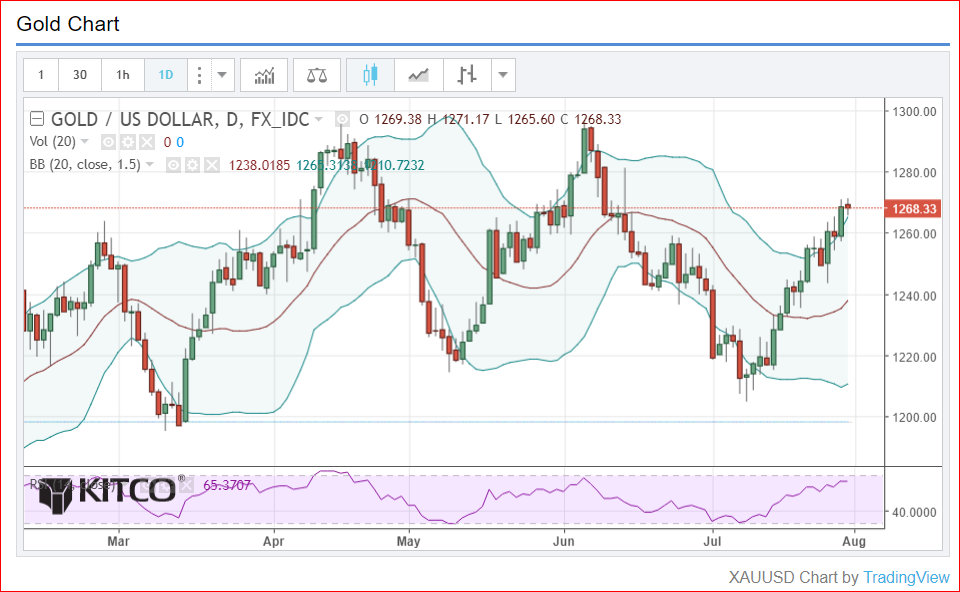
Having entered and exited a trade on the same day using a signal given us for a $9.00 profit, we are out. That does not mean the market is done rallying at all. It means for us, the signal's easy money trade is gone. Note the following in the Bollinger bands below. Bollingers are a part of the VBS signal used once other more proprietary indicators line up
- Widening bands in opposite directions are a signal to get long as an impulsive move is coming. - That happened, and we got long
- Once our predetermined risk/ reward was achieved, we got out - Risk 1 to make 3 in 72 hours. This has nothing to do with the VBS itself
- If the market stays above the widening top band and the bottom then band turns up (it is), volatility will likely decrease the current current direction, but it is not bearish. - Sometimes accompanied by a bullflag which breaks even more violently higher
- As long as the mid line of the BBands remains upwardly sloping all is good - Big help in gamma hedging, but in directional speculation this lends itself to big drawdowns and that is not our game with this signal
- We use trailing stops normally when profitable, and time limits and stop losses when not. But the VBS says stay long above $1255 on a settlement basis, and we will not risk that in this product
Spot Gold
live charts HERE
Algorithm Systems
VBS is not technical analysis. It is a momentum algorithm executed by hand. It was developed for better option related gamma hedging and is perfect for this as far as our requirements. But as a directional device VBS can give big drawdowns in profits before giving a sell signal especially because Precious Metals are prone to moments of manipulation due to their market structure. So we adjust.
Technical Analysis is BullS**t !! OR Why Losers Lose Money
Lately we have been getting a lot of reader comments saying technicals are useless in a manipulated market. VBS, EW, Charting etc are all based on price action. So manipulation would affect them for sure. So in deference to Gold and Silver's liquidity being discontinuous (vulnerable to algo spoofs), and concentrated order flow (easy to manipulate by "players") let's address that for a sec.
Manipulation isn't the problem. Manipulation is the result of a market structure that enables it. Manipulators find a way.
Manipulators Have Flashlights
So please stop whining that technicals do not matter in manipulated markets. Adapt or find something that is NOT manipulated if you can. The largest markets in the world are manipulated. Treasuries are manipulated at auction, via LiBoR, and directly by Fed intervention. We'd rather trade Gold where the manipulation is more recognizable and we can decide. There are people who, upon finding themselves sitting in darkness would rather curse not the absence of light as the cliche goes, but would rather curse the person who owns a $500 flashlight. This rather than simply lighting the candle in their hand.
We suspect those same people, upon getting that same flashlight, would blame it for their losses.
Good Luck
Soren K.
In Other News
North Korea
Kim Jong Un claimed that the entire continental United States is in range of his country's intercontinental ballistic missiles after North Korea test-fired one late Friday. President Donald Trump reacted strongly on Twitter, expressing frustration with China's lack of action against the Pyongyang regime. The U.S. engaged in military exercises with South Korea over the weekend in a show of strength, while President Xi Jinping said "the world isn't safe at the moment" when he attended a military parade yesterday.
Oil tops $50
A barrel of West Texas Intermediate crude for September delivery was trading unchanged at $49.71 at 5:15 a.m. Eastern Time after briefly trading above $50 earlier in the session. Short positions in WTI stood at less than half their end-of-June level over the week ended July 25, data from the U.S. Commodity Futures Trading Commission showed. Promises of more cuts from OPEC members, and oil-major quarterly results pointing to reduced investment in exploration, have spurred an uptick in bullish sentiment for the commodity.
Euro-area inflation unchanged
Consumer price growth in the euro area remained steady at 1.3 percent in July, according to the flash estimate from the European statistics agency. Core inflation, which strips out food and energy prices, rose to 1.2 percent, the highest level in three months. The data come as policy makers at the European Central Bank are gearing up for a fall debate on the future path of monetary policy. A separate release showed that unemployment in the common currency area fell to 9.1 percent in June. U.K. consumer credit growth slowed in June, while still rising 10 percent from a year earlier. Bank of England policy makers, who meet on Thursday to announce the latest interest-rate decision, have recently taken action to reduce the pace of unsecured leading in the economy.
Stocks rise
Overnight, the MSCI Asia Pacific Index rose 0.3 percent as commodity and energy producers rallied due to the rise in raw materials, while Japan's Topix index slipped 0.2 percent as the strong yen weighed on equity markets. In Europe, the Stoxx 600 Index was 0.3 percent higher at 5:40 a.m. as miners and positive results from HSBS Holdings Plc lifted the region's stocks. S&P 500 futures pointed to a gain at the open.
King dollar's abdication?
The U.S. dollar has been a big loser against all 16 major currencies this year, with currency traders betting on further declines. Analysts are now predicting the euro will rise to $1.20, from the current $1.1730, a huge turnaround from the start of year levels close to $1.04. A big factor weighing on the currency is the continuing political impasse in Washington as the administration fails to find a way to implement the president's agenda, tempering growth projections in the near-term for the world's largest economy. Those prospects will get an update this week with nonfarm payrolls data due.
Read more by Soren K.Group