Technical Traders Ltd. is issuing new analysis which indicates the US and global markets may be poised for a dramatic upside price swing over the next couple. Recent events have driven asset class values to new valuations that may change the dynamics of markets for a few months. Prior to August/September 2018, many traders were fearful of the expectations of the US Federal Reserve, Global Trade Issues and the US Elections. Combine this with the end of the year liquidity issues and the threat of a US government shutdown over the wall funding and we have almost a perfect storm brewing for uncertainty and fear.
Now, it appears, our custom global market indexes are showing signs that a bottom may have formed over the past few weeks and that the global equities markets may be poised for an upside move in the range of +10% to +20% over the next 2-4 months.
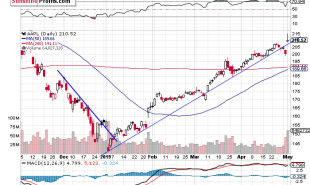
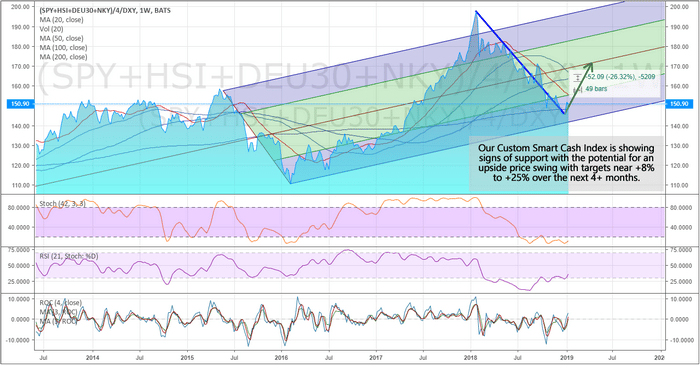
“What changed over the past month?”, you might be asking? Valuation levels have changed. The chart below is a Weekly chart of our Custom Smart Cash index. We use this as a measure of global equity market valuation and to determine if and when pricing levels are changing in terms of total market capitalization. We can see from early 2018, the global markets peaked and began to move lower. Even though the US markets pushed higher throughout this time, the total global markets continued to deteriorate. Now, the valuation levels are near historic channel support and have begun to flip back to the upside (at least in the immediate term). If this continues as capital re-enters the global capital markets in search of undervalued opportunities, this capital will find quite a few opportunities in beaten up global equities. Pay attention because this could be the setup of a market bottom with relatively strong upside potential.
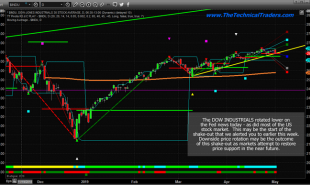
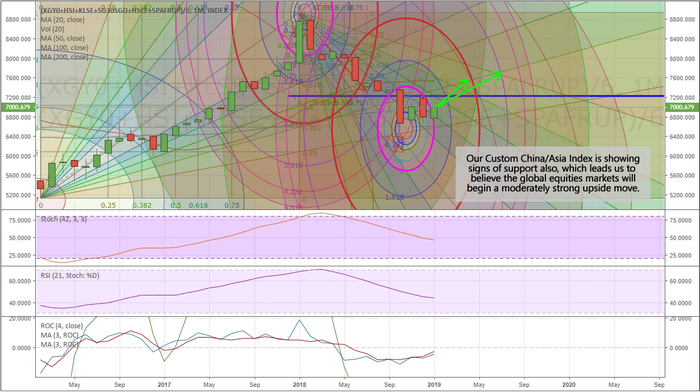
One item to pay attention to is our Custom China/Asia index. This chart, below, is a Monthly Custom China/Asia market index. It may be somewhat hard to understand with all of these Fibonacci Arcs drawn on it, but to us, this is a very clear chart. These Arcs are an advanced way to look at Fibonacci price support and resistance. We look for how these arcs relate to price activity and how they converge in past and future price points. Our belief is that each price move initiates and perpetuates with a certain energy level and frequency. If we are able to identify this level and frequency, then we may be able to attain greater knowledge of the future price turning points, support, resistance, and other key information. As you can see, the bottom on this chart occurred right within the Top Arc's primary frequency levels near 4.5x the base frequency level – or 2x the immediate frequency level. This is a fairly common level for the price to form tops/bottoms. 2X equals 200% of an immediate price level energy frequency.
We believe China/Asia may experience an upside price swing of nearly +8 to +15% over the next couple of months as the global markets attempt a price recovery. This means that there may be some opportunity in the Asian markets through April/May 2019. We urge investors to be cautious of the Summer months of 2019 because we don't expect this move to last long.
This means skilled traders will be able to find and execute a broad range of successful and profitable trading opportunities over the next 2 to 4 months. Get ready for 2019 to be a very good year for traders and learn how our daily market research, stock, ETF, and futures trading signals can save your time and money. Start executing the best opportunities today with www.TheTechnicalTraders.com.
Chris Vermeulen
Read more by TheTechTrader