$1280 Gets you $1320
Gold Today:
interactive Chart HERE
On March 27th we said that Gold had room to move and $1320 within 6 months is not a stretch by any means. So far, so good.
From that Article:
Plenty of Room to Move
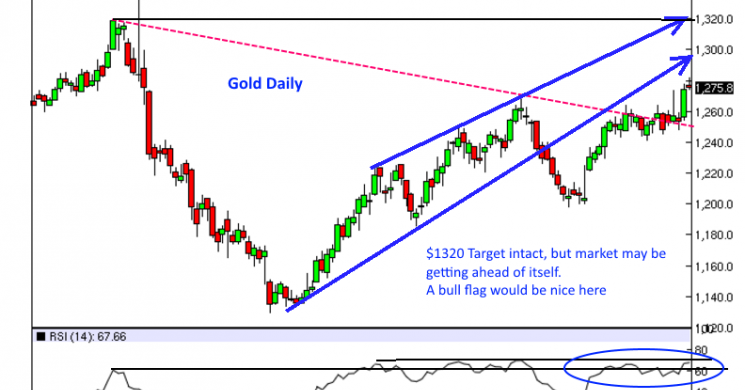
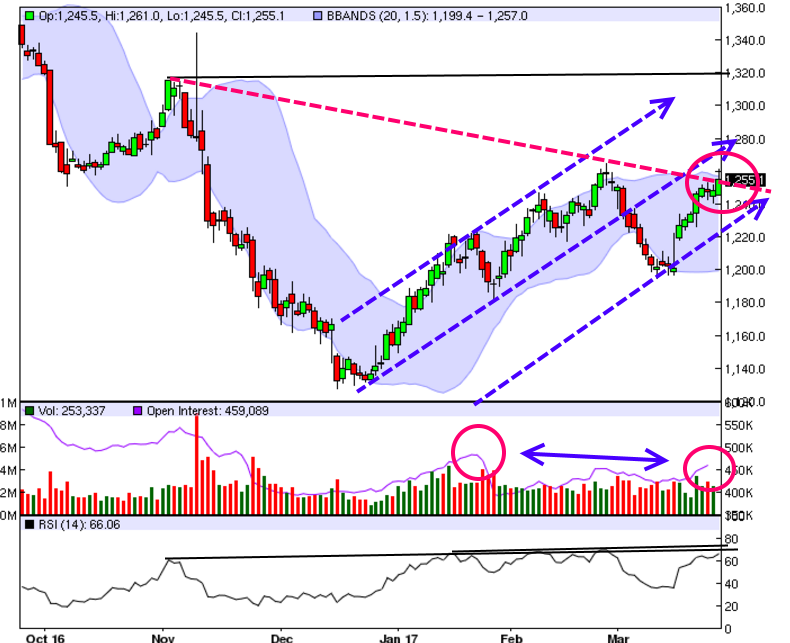
Volumes and Open interest show the market has room to move higher. The descending red line has been pierced today. A settlement above that would be one less upside obstacle to overcome. Option expiration and the April contract could stall the rally. However, the growing uncertainty domestically, and the EU issues coming to a head (put never quite getting resolved) will continue to bolster support underneath. A six month target of $1310-$1320 is reasonable If we have healthy pullbacks and OI stays under $550k giving us a sign that "hot money" isn't pushing too hard. Healthy pullbacks would be on seeming closure in EU risks. But we all know that just is never going to be over. Any opiating EU news items are a dip to buy in our opinions.
Full Post HERE
-Soren K. Group
A couple charts to that effect:
Mar 27th: Here is the chart that showed a break above the red line at $1255 was key to the rally's continuation
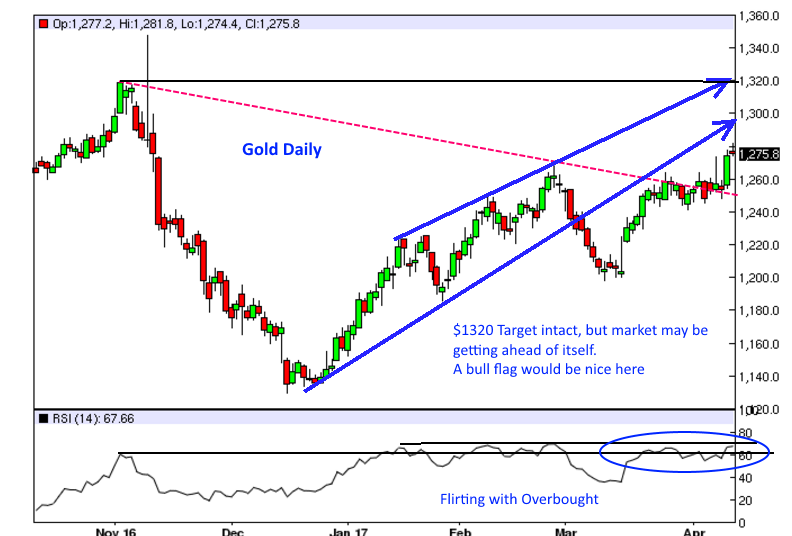
More from the MarketSlant Article: Gold on Mar 31 showing what had to happen for the upswing to continue. And thankfully it did.
Note the upsloping trend line coming in at the $1280 area. This is consistent with Michael's assessment that $1278 is an area of resistance. We just do not think that $1278 is that big a deal. But his logic is good, and should be noted. Read on for the resistance at $1278 case.
Gold Rally Approaching Critical Resistance at 1278
via Michael Boutros and the DailyFX
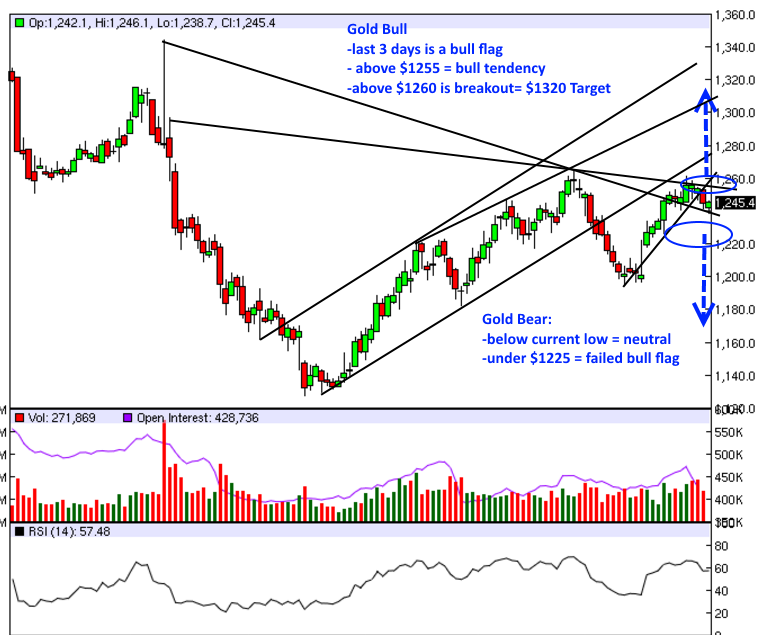
Bottom line: gold is coming into some serious resistance here with the long bias at risk heading into this key region. Interim support now back at the 200-day moving average with a break sub-1241 needed to shift the medium-term focus lower. From a trading standpoint, I’ll be looking for exhaustion / short-triggers on a move into the upper parallels. That said, if we break higher there’s open range to the May highs at 1303.
Gold Daily

Gold is attempting to close above the 200-day moving average for the first time this year & after five failed attempts. The focus now shifts to critical resistance highlighted last week around 1278- this region is defined by the 100% ext of the advance off the December lows & the 61.8% retracement of the decline off the 2016 high and converges on key longer-term slope lines extending off the 2011 record highs & the 2016 high.
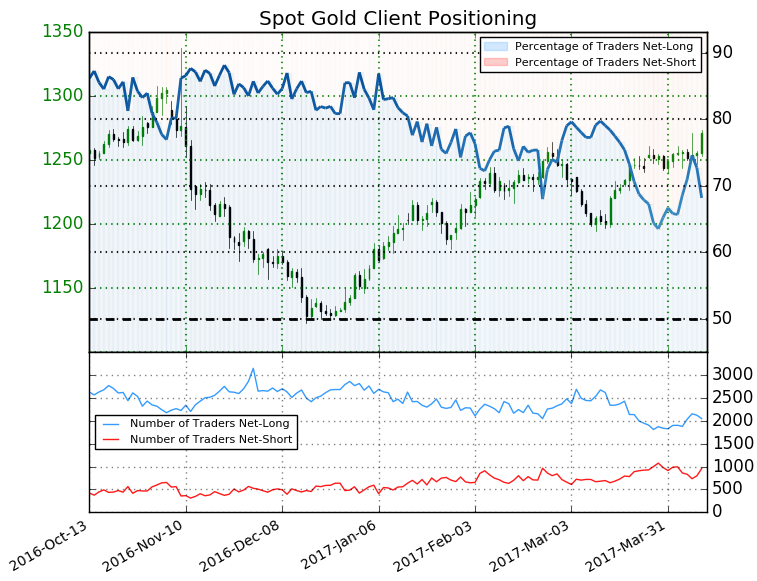
- A summary of the DailyFX Speculative Sentiment Index (SSI) shows traders are net-long Gold- the ratio stands at +2.14 (68.2% of traders are long)- bearish reading
- Long positions are 6.1% lower than yesterday but 5.3% higher from last week
- Short positions are 10.7% higher than yesterday and 7.7% lower from last week
- Despite the fact retail remains net-long, the recent build in short positioning continues to highlight the immediate topside bias- but look for this to change as prices approach key resistance.
About:
The Soren K. Group of writers are currently 5 persons writing collectively. Backgrounds are professional, ranging from Finance to Banking to Real Estate. Topics include politics, markets, and Global Macro situations with a libertarian bent. Some posts are collaborative, some individually written.
Email: Sorenk@marketslant.com
Twitter: @Sorenthek
Read more by Soren K.Group


