
On Monday I had the opportunity to attend a conference at Goldman Sachs’ Dallas office. Among the dozens of money managers and investors who attended, a combined $1 trillion in assets was represented. The speakers were numerous, from famed economist Jan Hatzius, Goldman’s head of global economics, to Jeff Currie, global head of commodities research. Everyone was exceedingly smart and articulate, and I left the conference feeling recharged with much to think about.
One of the most fascinating takeaways was Goldman’s increased use of sentiment analysis tools. Basically what this means is sophisticated software trawls the internet in real time for public attitudes and opinions on companies, products, sectors, industries, countries—you name it. Sources can include press releases, news stories, earnings calls, blogs, social media and more. All of this data is gathered and analyzed, giving quants and other highly sophisticated investors a better idea of where tomorrow’s opportunities lie.
We have experience gauging sentiment using platforms designed by Meltwater and ScribbleLive, and I was pleased to see our efforts validated.
Goldman’s preferred system is Stanford’s CoreNLP, which is able to break down and analyze sentences in a number of different ways (and different languages to boot). Below is just a sampling of what the process looks like.

This strategy has been working well, Goldman said, and investors and managers plan to continue practicing it.
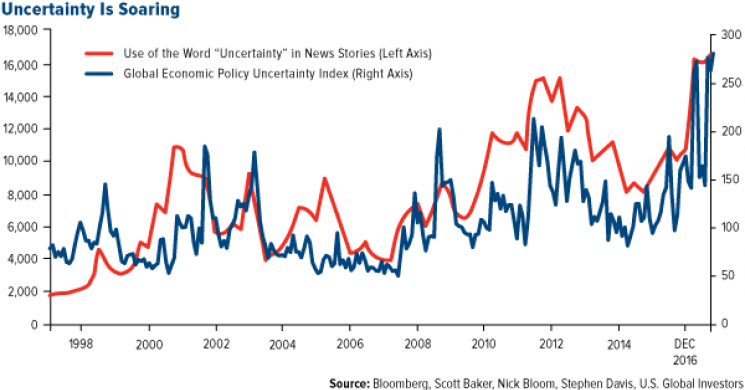
As I said, we take sentiment very seriously. In last week’s Investor Alert, we made note of the fact that the media’s use of the word “uncertainty” has soared to a record high since the November election. This is in line with recent movements in the Global Economic Policy Uncertainty Index, which is also now at all-time highs following Donald Trump’s election and Brexit in the U.K.

Goldman Bullish on Commodities
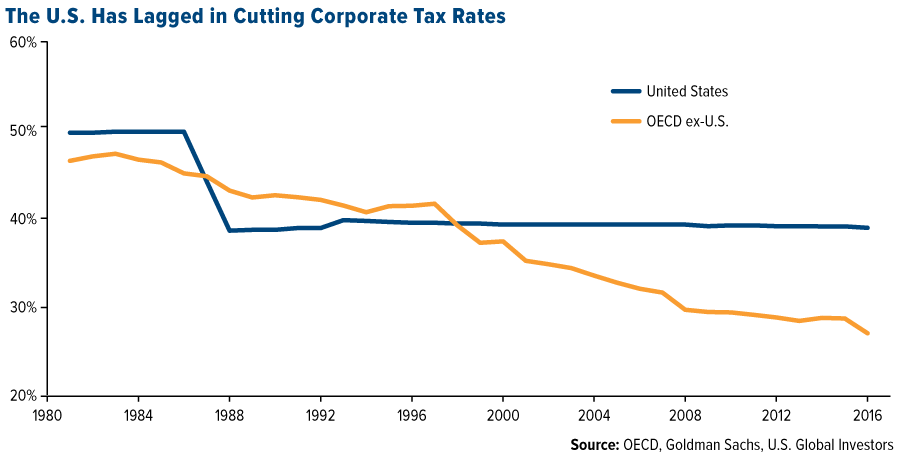
At the same time, small business optimism in the U.S., as measured by the National Federation of Independent Business (NFIB), soared to a 12-year high on the back of Trump’s election. At 105.8, its December reading was up a phenomenal five standard deviations. Much of this optimism was driven by Trump’s pledge to roll back regulations and lower corporate taxes, a point I’ve made several times already. Goldman echoed this thought, arguing the U.S. is behind the curve on cutting corporate taxes, compared to the average rate of the 35-member Organization for Economic Cooperation and Development (OECD).
Using its sentiment analysis tools, however, Goldman managed to come to these conclusions as early as November—which is the same month the investment bank turned bullish on commodities for the first time in four years.
Goldman’s line of reasoning? When business optimism goes up, capital expenditure (capex) also goes up, and when capex goes up, commodities tend to follow. I should add that the bank has historically been neutral on commodities, recommending an overweight position only four times in the last 20 years. So when it does become bullish, investors should pay attention.
Look at the Timing
But there’s more to the commodity investment case than sentiment. The timing looks ideal as well.
Below, take a look at the output gap, which measures the difference between an economy’s actual manufacturing output and its potential output. When the gap is positive, that means demand is high and output is at more than full capacity. When it’s negative, that means demand has shrunk and output is less than what an economy should be capable of producing.
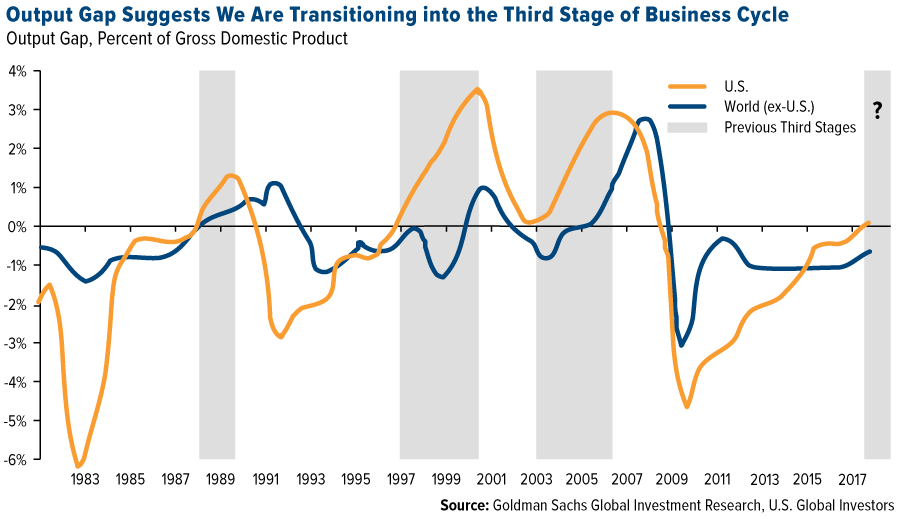
You can see that the output gap in the U.S. is finally turning positive, therefore entering the third stage of the business cycle, the best for real assets. The third stage is expansionary, characterized as having high output and fast growth—not to mention traditionally higher returns. We all know that past performance is no guarantee of future results. But similar periods in the past—shaded in gray—were associated with commodity super-cycles, the most recent one being the 2000s commodities boom driven by emerging markets, particularly China.
So far this year, the Bloomberg Commodities Index has risen 1.7 percent, compared to a negative 3.4 percent for the same number of trading days last year. If you remember, commodities ended positively in 2016 for the first time in six years, so there should be further room to run.
The Global Economic Policy Uncertainty (EPU) Index is calculated as the GDP-weighted average of monthly EPU index values for the U.S., Canada, Brazil, Chile, the U.K., Germany, Italy, Spain, France, the Netherlands, Russia, India, China, South Korea, Japan, Ireland and Australia, using GDP data from the International Monetary Fund’s (IMF) World Economic Outlook Database.
Standard deviation is a measure of the dispersion of a set of data from its mean. The more spread apart the data, the higher the deviation. Standard deviation is also known as historical volatility.
The Bloomberg Commodity Index is made up of 22 exchange-traded futures on physical commodities. The index represents 20 commodities, which are weighted to account for economic significance and market liquidity.
Read more by Frank Holmes


