
The market has experienced a week that was much like the week before; earnings coming in lower when compared to a year ago, but higher than the lowered expectations (-6% compared to -9%). Like the week before, the S&P 500 has fallen, but it hasn’t fallen apart. This may be due to an expectation of sunnier days ahead in the next six months. However, since there hasn’t been, nor is there any expectation of real revenue growth in the future, companies will be forced to continue cost-cutting, and buying-back shares in order to deliver an illusion of growth. The market, while not completely fooled by this, has not fully priced it in either.
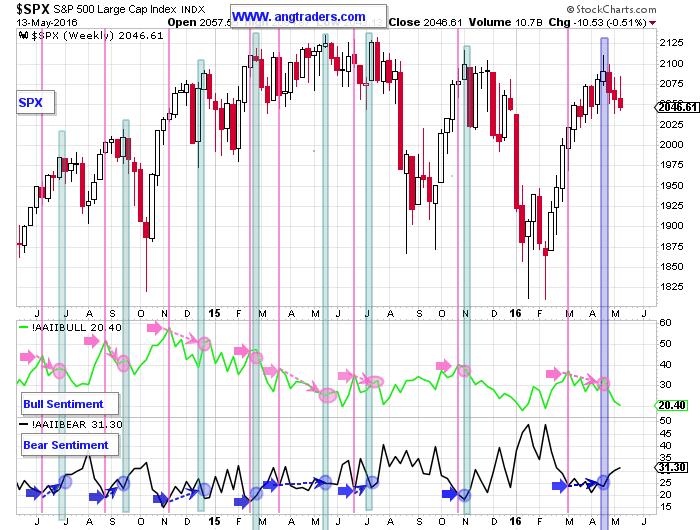
Our Price Modelling System continues to point to lower equity prices, and the sentiment patterns are, likewise, confirming a local top in the S&P 500 (chart below).
From a longer-term perspective (chart below), a pattern of future reduced valuations is also in effect.
Lastly, the chart below shows how a divergent move in the Rydex Bull assets verses the S&P (assets trend down, while the S&P trends up or is flat) is followed by a drop in the S&P.
All of this, of course, involves probabilities not prophecies.
{This section is for paid subscribers only}
ANG Traders
Join us at www.angtraders.com and replicate our trades and profits.
Read more by ANGTraders


