

If you want to know about the past, a good place to start is by looking at GDP. It tells you the dollar value of a country or region’s goods and services over a specific time period. But GDP’s like looking in the rearview mirror, in that it shows you where you’ve been and little more. It’s “blind” to what’s ahead of you.
For that you need another indicator, and if you’re a regular reader of the Investor Alert or Frank Talk, my CEO blog, you probably know which one I’m referring to: the purchasing managers’ index (PMI).
Unlike GDP, the PMI forecasts future manufacturing conditions and activity by assessing forward-looking factors such as production levels, new orders and supplier deliveries. PMI, then, is like the high beams that help guide you at night through the twists and turns of a mountain road.
Several times in the past, we’ve shown that there’s a high correlation between the global PMI reading and the performance of commodities and energy three months later.
When a PMI “cross-above” occurs—that is, when the monthly reading crosses above the three-month moving average—it has historically signaled a possible uptrend in crude oil, copper and other commodities. Our research shows that between January 1998 and June 2015, copper had an 81 percent probability of rising 7 percent, while crude jumped the same amount three-quarters of the time.

But the reverse is also true. When the monthly reading crosses below the three-month moving average, the same commodities and materials have in the past retreated three months later. And as I mentioned last week, the global PMI fell in December, from 51.2 in November to 50.9. The reading also crossed below the moving average.

As you can see, the PMI has been in a relatively steady downtrend since midyear 2014, signaling the decline in commodities during the same period.
Below is our newly-released Periodic Table of Commodity Returns, which has consistently been one of our most popular research pieces year after year. Precious metals ended 2015 as the best-performing group, with palladium, gold and silver ranking among some of the more resilient commodities. A high-resolution copy of the table is available for download.

Time to Cut the Red Tape
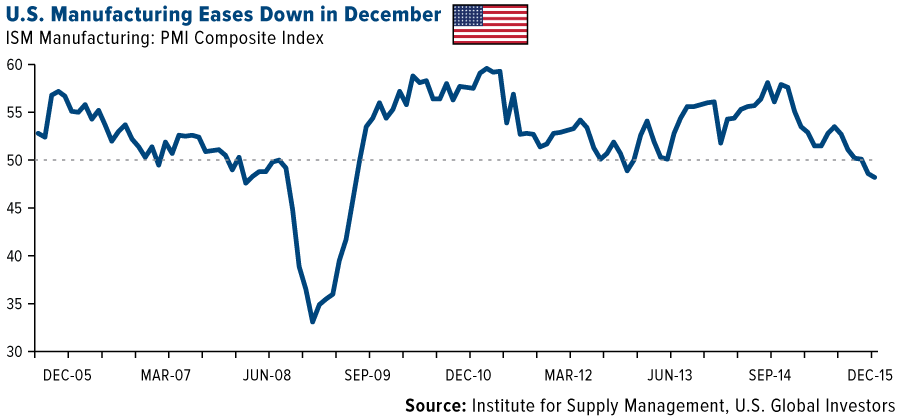
One of the main contributors to the lower global PMI reading in December was weak American manufacturing activity, according to a recent report from Cornerstone Macro. The research group had expected an improvement, but the one-month U.S. PMI reading landed “with a thud” at 48.2, its lowest point since June 2009.
China also contracted in December, dropping to 48.2. The reading also crossed below the three-month average.
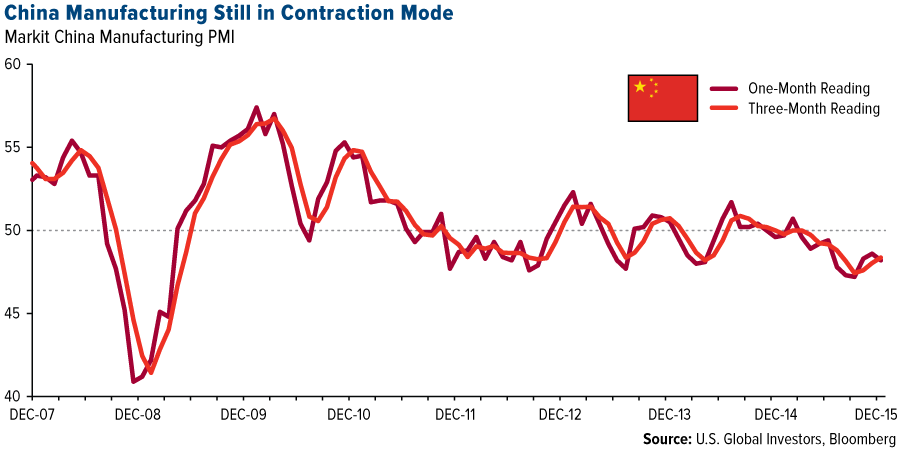
The Asian giant is responsible for consuming massive amounts of raw materials—60 percent of the world’s concrete, 54 percent of aluminum. So when the PMI falls in both China and the U.S., the two largest economies in the world, it’s not a good sign.

Cornerstone cites the strong U.S. dollar, weaker exports, rising manufacturing inventory and the plunge in oil prices as factors that led to the downturn last month.
I agree that these factors played a huge role—oil slid below $30 per barrel this week—but I would also add more burdensome regulations to the list. Such rules have gunked up the gears of industry, and it’s essential that they be cleaned out to ignite synchronized global growth.
It’s hard to overemphasize just how important the American manufacturing sector is to the national (and world) economy. According to the National Association of Manufacturers (NAM), manufacturing has the highest multiplier effect and drives more innovation than any other sector. For every $1 spent on manufacturing, $1.40 is created and pumped back into the U.S. economy. The sector employs more than 12 million Americans, or roughly 9 percent of the workforce, and supports more than 18 million additional jobs.
If it were its own country, American manufacturing would be the ninth largest in the world.
And yet the cost of federal regulations falls disproportionately on manufacturers, who pay an average $19,500 per worker in compliance costs—about $10,000 more than what other industries must pay on average.
George Mason University’s Mercatus Center, a free market think tank, studied the effects of federal regulations on the productivity of various industries between 1997 and 2010. Unsurprisingly, the group found that the most regulated industries experience the least amount of growth. Whereas output per person for lightly regulated companies grew 63 percent during the period, output grew only 33 percent for those that carry heavier regulatory burdens.
More rules means less productivity and efficiency. As an analogy, imagine if professional basketball were played with more referees than players on the court, and with more rules than anyone can remember. No one would be able to score! This would have a huge multiplier effect: Viewers would drop off, ticket sales would plummet, advertising would dry up, and much more.
We must ensure that this doesn’t happen in manufacturing.

TPP to Unleash Global Trade
To achieve synchronized global growth, policymakers from the G20 countries must commit themselves to cutting red tape.
Look at how quickly energy and shipping companies shifted into gear after Congress lifted the 40-year-old oil export ban less than a month ago. Two tankers have already departed from Corpus Christi, Texas, to deliver crude to Europe. In anticipation of the policy change, infrastructure companies have poured billions into building new pipelines and oil storage facilities and expanding loading capacity at ports.

That’s why I’m excited for Congress to ratify the Trans-Pacific Partnership (TPP), which was finally settled upon in October by the 12 participating nations, the U.S. and Canada included. Since then, I’ve been writing and speaking extensively about the TPP, yet I can’t seem to emphasize enough how vital the passage of this landmark free-trade agreement is for global economic growth and job creation.
Once ratified, 18,000 tariffs are expected to be eliminated among the 12 TPP nations, which together account for 40 percent of global GDP and 20 percent of global trade. The World Bank estimates that individual GDPs will rise between 0.4 and 10 percent by 2030 as a direct result of the TPP.
Could 2016 Be Gold's Turnaround Year?
As the Periodic Table of Commodity Returns above indicates, gold has seen annual losses for the past three years. But there are already signs that 2016 could reverse the trend. With equities around the world weakening, more consumers have been turning to the precious metal as a safe haven.
In China, physical delivery from the Shanghai Gold Exchange reached a record 2,596 tonnes, or a whopping 80 percent of total global output for 2015.

In addition, the People’s Bank of China reported adding 19 more tonnes in December, bringing the total amount to over 1,762 tonnes.
Meanwhile, here in the U.S., demand is just as electric. On January 1, Americans gobbled up unprecedented amounts of gold and silver coins from the U.S. Mint, purchasing in one day a sizable percentage of total sales in the entire month a year ago.
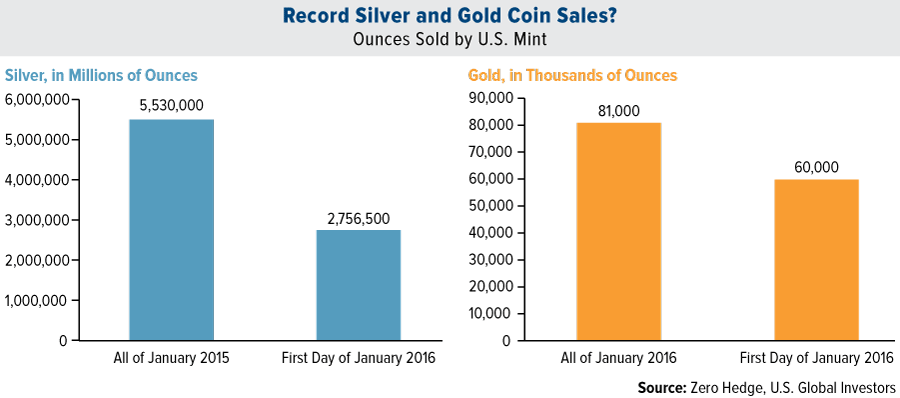
“Should the epic demand for precious metals from the first day of sales persist,” writes Zero Hedge, “we are confident that the Mint will run out of gold and silver within a few days.”
We will continue to monitor the global PMI, and once the global, China and U.S. readings all cross above the 50 mark, it’ll be time to lock and load.
Later this week I’ll be speaking at the Vancouver Resource Investor Conference, the world’s largest investor conference for resource exploration. I hope to see you there, but if you can’t make it, I’ll be sure to share with you my thoughts and takeaways.
U.S. Global Investors, Inc. is an investment adviser registered with the Securities and Exchange Commission ("SEC"). This does not mean that we are sponsored, recommended, or approved by the SEC, or that our abilities or qualifications in any respect have been passed upon by the SEC or any officer of the SEC.
This commentary should not be considered a solicitation or offering of any investment product.
Certain materials in this commentary may contain dated information. The information provided was current at the time of publication.
Some links above may be directed to third-party websites. U.S. Global Investors does not endorse all information supplied by these websites and is not responsible for their content.
All opinions expressed and data provided are subject to change without notice. Some of these opinions may not be appropriate to every investor. By clicking the link(s) above, you will be directed to a third-party website(s). U.S. Global Investors does not endorse all information supplied by this/these website(s) and is not responsible for its/their content.
The J.P. Morgan Global Purchasing Manager’s Index is an indicator of the economic health of the global manufacturing sector. The PMI index is based on five major indicators: new orders, inventory levels, production, supplier deliveries and the employment environment. The ISM manufacturing composite index is a diffusion index calculated from five of the eight sub-components of a monthly survey of purchasing managers at roughly 300 manufacturing firms from 21 industries in all 50 states.
The S&P 500 Materials Index is a capitalization-weighted index that tracks the companies in the material sector as a subset of the S&P 500. The S&P 500 Energy Index is a capitalization-weighted index that tracks the companies in the energy sector as a subset of the S&P 500.
By Frank Holmes
Read more by Frank Holmes


