Intro:
If you are trading Gold or any other precious metal, understanding USD fundamentals and technicals is of the essence. We have noted here that over the last 2 days Gold has done well despite a stronger USD. The question begged from this is "How will the yellow metal do if the USD crashes?" That answer should be obvious as Gold is denominated in dollars. Gold is beginning another phase of remonetization we feel.
Ths USD is stronger no doubt today, as the EU and GBP suffer under the weight of their own monstrous balance sheets. For now the USD is the tallest pygmy, and we feel the last to circle the drain. Thus, we need to understand better the USD's fundamentally driven longer term technicals. Below is some analysis with which we agree. Here is a possible reason and path towards that drainage. In short: The monthly chart doesn't look so well for the USD.
Be warned, TDOK analysts use Socratic method and are not shy about using some pepper. These are traders with an ability to convey their ideas and assume the reader is familiar with the landscape. Read on - Soren K.
emphasis ours
USD: Where Are We Now?
Via TDOK AnalyticsWe are at a point of no return, and imminent volatility, as the USD has closed out the month of January 2017 locking in a monthly bearish signal. We can see the negative divergence in the monthly chart below. As I wrote in my initial post, the January close is an utmost critical event to occur to the capital markets in a very long time. The Fed has been irrelevant since the taper. Interest rate markets have proven that, time, and time again. They had the chance to begin the normalization process, and reduce the size of their balance sheet at that time. They decided against it for obvious reasons. If the reason happens to escape you, then think about this: if the only way you could survive is by borrowing every single day, how high would you want your interest rate to be? Exactly. Moving on.

Long USD Positions Reduced, But Why?
Below, we can see that large specs have reduced their long exposure to the USD. Similarly, commercial players have reduced their shorts. Have we begun to see a reversal of positioning or are we seeing some profit/loss-taking? I suspect the latter, as the USD has broken significant levels of support into a monthly sell signal. Nothing for the faint of heart. I also expect the respective market participants to try again - i.e. commercials will get short again, and large specs will get long again. [Edit- this may be what we are now seeing today- S.K.] It's important to note that positioning is still on the extreme side of things. The current levels that we are seeing at the moment are consistent with previous high/low levels. I would also take heed of the fact that commercials are shorter than large specs are long. A key indicator of which way the market could go. I think we're going to see lower as stated above. Therefore, so far that's two important technical factors that line up the thesis for a move lower.

Daily Chart Analysis- seems like a lot of support
Below, I have annotated every support level that the USD has near-term. We have breached 100.60, which has also become resistance as we can see below. During February 2nd's trading session, we hit trend line support at 99.20 and support at 99.45. As of today's close, it seems as if the USD will see 100.60 soon enough, as we have positive divergence locked in for a buy signal. The key will be to see what happens when the RSI indicator reaches the 40/60 area. Since 100.60 isn't that far from 99.20, on a daily basis, it is possible that we may even see 100.60 before the week is out. That won't lend itself to much of a big move in the RSI. However, it may be enough to get it into those resistance areas previously mentioned.

Weekly Dollar Chart- about that support, not so much
Below we have a weekly USD chart. It is the best view of the negative divergence sell signal. Once price breaches the 96.80 area, there isn't anything much to support it, besides all of the longs positions that will have to begin to liquidate as their risk limits start to get hit. The RSI has also broken below trendline support. A move back to the 60 area for the RSI could cap the up-move in the USD. I can not see that level being reached in the RSI until price reaches the 101.75-102 area. That would be the ideal area to place a short on a pull back with a stop at 104, with am initial target of 91.58. [Edit- and when this happens, note where Gold is and trade accordingly-S.K.] If we breach the "danger zone," at 90.60, there isn't much of anything below it until the 85.00 area.

- More by Bondskew and TDOK
- follow on twitter @bondskew
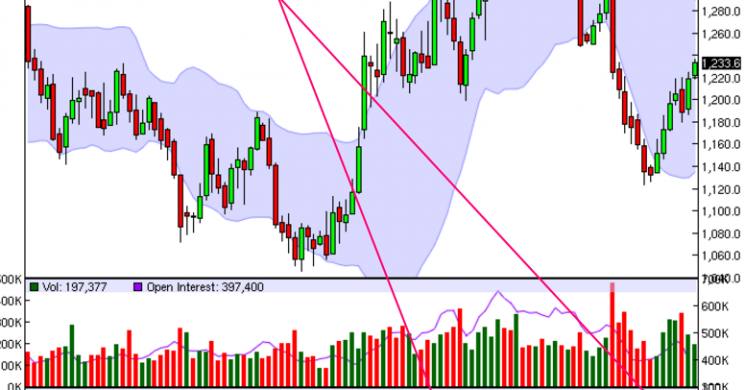
For Gold players, as implied above, the weekly chart (RSI) looks better than the daily to us.- Soren K.

interactive chart HERE
Good Luck
Read more by Soren K.Group


