Earnings reports this week delivered mostly upside surprises and the S&P 500 reacted by marching higher until Thursday when both Google and Microsoft surprised to the downside. By Friday, the market decided that these negative surprises were largely confined to those companies and recovered some of the previous day’s losses to finish higher on the week, although well off the week’s high. Earnings season is turning out to be not as bad as feared, but it is early in the season, and May is just around the corner-- “Sell in May and go away” is still a possibility.
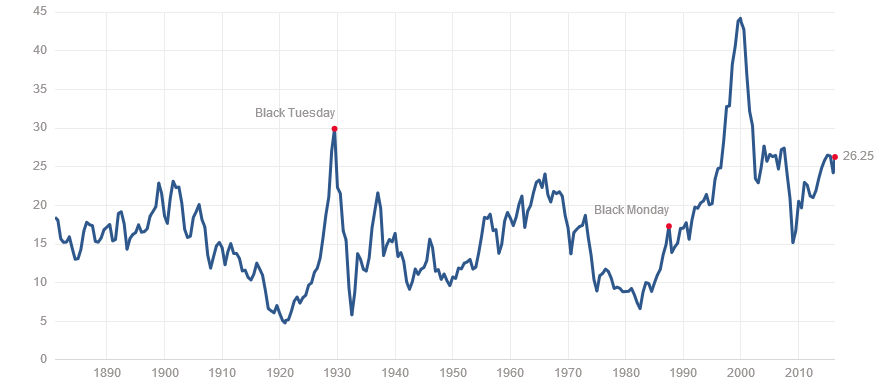
As the chart below shows, the PE ratio for the S&P is climbing back up and is at levels well above the historical average (15).
S&P 500 PE Ratio
(http://www.multpl.com)
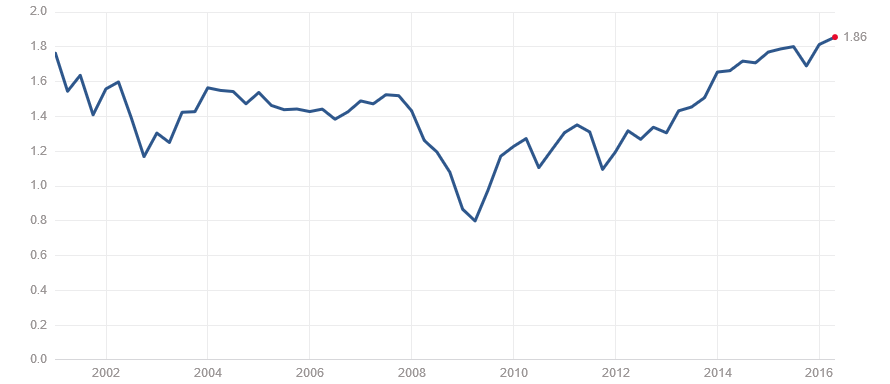
The price-to-sales ratio at 1.86 is the highest it’s been in fifteen years. Investors are paying a premium for the economic activity of companies.
S&P 500 Price-To-Sales Ratio
(http://www.multpl.com)
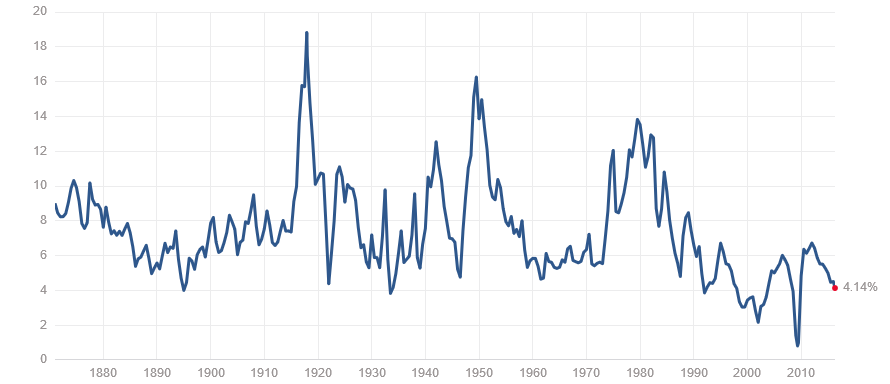
The yield on the S&P continues to slip, and is at about half of the historical average of 8%. However, considering how much lower alternative yields are, this may not be very meaningful.
S&P 500 Earnings Yield
Fundamentally then, we don’t see equities as a bargain and are not about to go chasing prices higher. The pressing question we all have is; are we topping out, or are we at least nearing a top?
{This section is for paid subscrbers only}
Our Price Modelling System has gone from giving a weak negative to a moderately negative signal, but we are cautious about increasing our short equities position at this time. We will maintain the SPXS position for now, and will add to the short side if the risk/reward of the situation improves (watch for Trade Alerts).
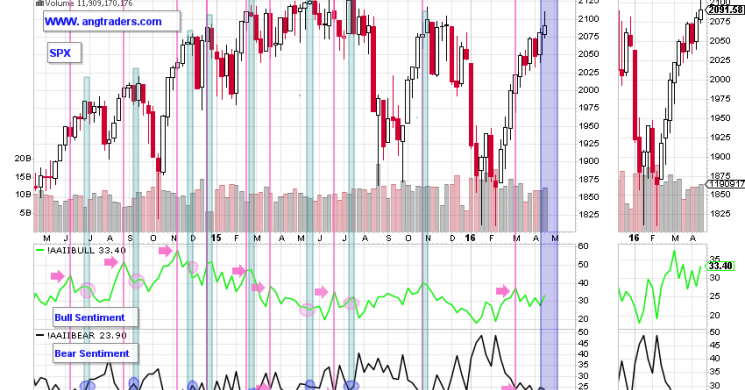
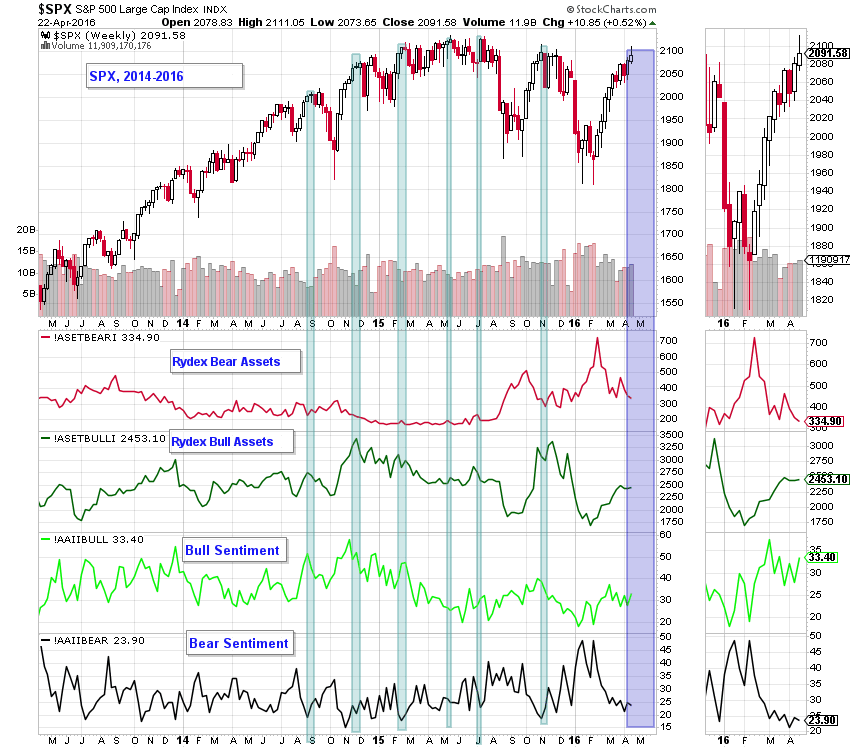
The sentiment indicators for the market are still not proving to be decisive. On the chart below we see the following:
- Bear assets declined slightly (bearish)
- Bull assets where unchanged (neutral)
- Bull sentiment increased, but still not elevated (neutral)
- Bear sentiment decreased (bearish)
On the chart below, we have high-lighted the local tops for the S&P (green rectangles) and have marked upward spikes in the Bull Sentiment, and downward spikes in the Bear Sentiment (pink vertical lines and pink arrows) that occur ahead of the local tops. Notice that the Bull and Bear spikes occur one to four weeks in advance of the S&P tops.
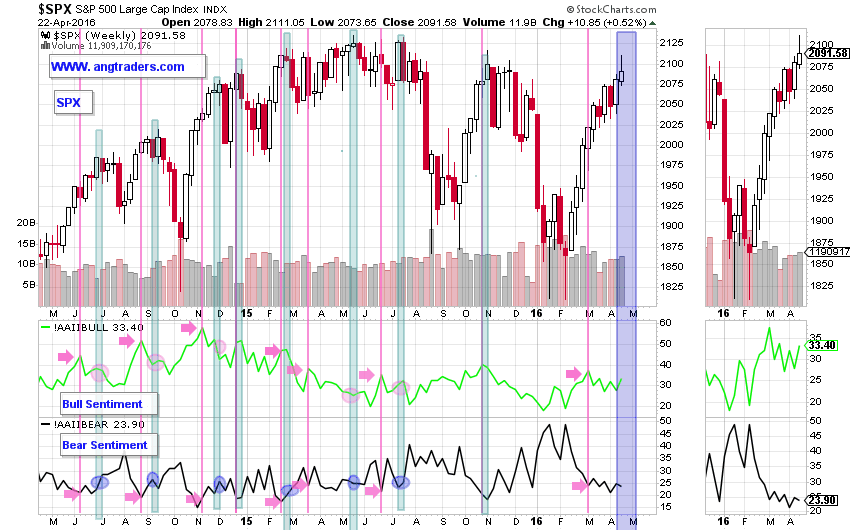
In almost every case, the Bull Sentiment is lower (pink ovals), and the Bear Sentiment is higher (blue ovals) when the S&P makes a top than at the spike that preceded it. This may be an indication of the “wall of worry” that markets sometimes rally on. In any case, the slight increase in fear just before the market tops is highly predictive.
So what does this say about the present situation? Most recently, the Bull Sentiment spiked five weeks ago and is now lower than it was then. The Bear Sentiment, however, is lower than it was then which is not what normally happens at tops. We would like to see the fear indicator increase before we increase our shorting activity.
{This section is fro paid subscribers only}
The possibility also exists that a new (higher) spike in the Bull Sentiment may be about to form before the market tops. We will be watching.
ANG Traders
Join us at www.angtraders.com and replicate our trades and profits.
Read more by ANGTraders


