Crude: Is It Really Going To the Moon?
Originally published on The Dispensory of Knowledge (TDOK)
We have seen the many market reactions via the innumerable headlines coming out of OPEC meetings over the past couple of quarters. Really since the beginning of 2016, as we can see in the quarterly chart below. The major Q116 "reversal" candle where crude changed direction during the month of February, from the low $26/bbl area. That reversal was caused by a multitude of factors such as short covering. That is, where buyers are actually closing out positions that made money while crude moved lower.
 Crude Futures, Continuous, Quarterly - tradingview.com
The large speculative entities that considered and, or bought into OPEC headlines during the beginning of the year were a factor as well. The OPEC and OPEC countries have been on a verbal rampage, only to cause extreme volatility to their own income streams over the past year. Who can really blame them, though? They also believed that crude would magically stay at a price greater than $100/bbl, while they maintained production at lofty levels, and to their heart's content. Per the chart below, when mid 2015 came around, production finally topped out, and price was already on it's second leg down. Fast forward to today, and it's really more of the same. The real smart money, in crude, is skeptical of any OPEC/OPEC country's statements via wires. As they ratcheted up the rhetoric in Q3 2016, so did they ramp up their production, coincidentally.
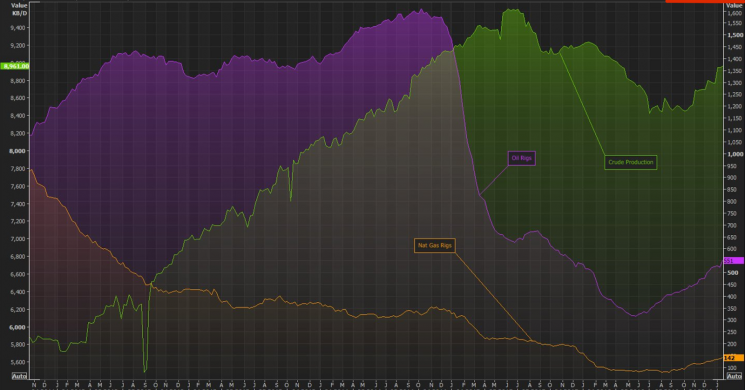
 Crude Production, 10/28/11-1/22/17, @EnergyBasis (twitter) - https://twitter.com/EnergyBasis/status/825062684546756608
What are the odds of that happening by itself? Without the help of fake promises to cut production, while simultaneously increasing production without having anyone see what they are actually doing. We see this via headlines everyday out of many news outlets from all over the world. It's not a secret, by any stretch. In the monthly crude chart below, we can see that is has also run into trend-line resistance, which intersects with momentum as indicated by flatter steepness in the most recent run up in the RSI indicator, versus the initial slope of the move off of the February lows.
 Crude Futures, Continuous, Monthly- tradingview.com
However, taking a look at the weekly chart below, we have negative divergence as of the first week of January 2017. We can also see a rising wedge formation that could culminate in March 2018 if the pattern holds true. That's if crude can stay bid around the 45.50 area and above.
So even if crude isn't going to crap the bed for the next year, assuming the market can stay irrational for that long given current positioning, we have a potentially nice rising wedge to take advantage of until it breaks. As break it will. Production is on the rise again all over the globe, and that is contrary to the promised cuts, etc.

Full story HERE
Follow TDOK3 on twitter @bondskew
Read more by Soren K.Group