Earlier today we reminded ourselves the hazards of having a single price as a trend negater. It was a one time isolation of our risk price that made us abandon hope for the wave count we had been following. And so we return to see where our favorite EW chartist is. The answer: same place he always was.
We have made it clear we are big fans of Enda Glynn's Elliot Wave work and continue to be. Enda is still enthusiastic about $1550 prospects for Gold and we can't argue. It was his analysis that corroborated our work and started the "Project $1550" posts. It was our own risk parameters that took us out of longs, not his.
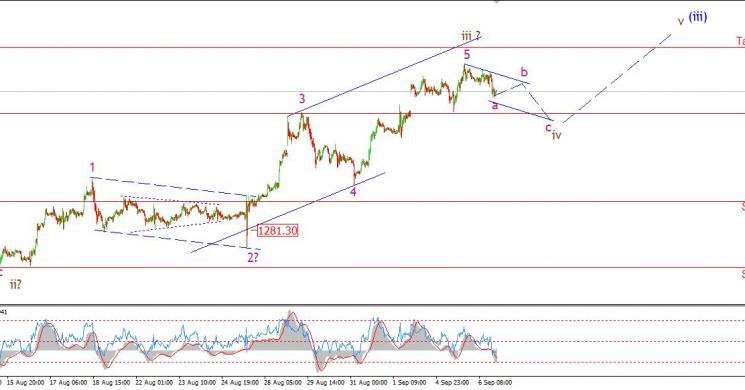
Here is his latest. Note well that the wave counts in both Gold and the Yen are bullish. Something may have to give here, unless there is an
event that strengthens gold, the dollar, and weakens (increases yen per USD) we don't see both in reading in the same time frame. But we also aren't taking into account that maybe Japanese inflation is coming. Stranger things have happened for sure.
Maybe just be long the Euro?
Anyway, we'll have a question on that into Enda shortly and let you know the feedback. In the meantime, the Gold
work has been spot on all summer. And it again aligns with our seeing a pullback in the cards for ourmuch beleaguered, but never beaten store of value.
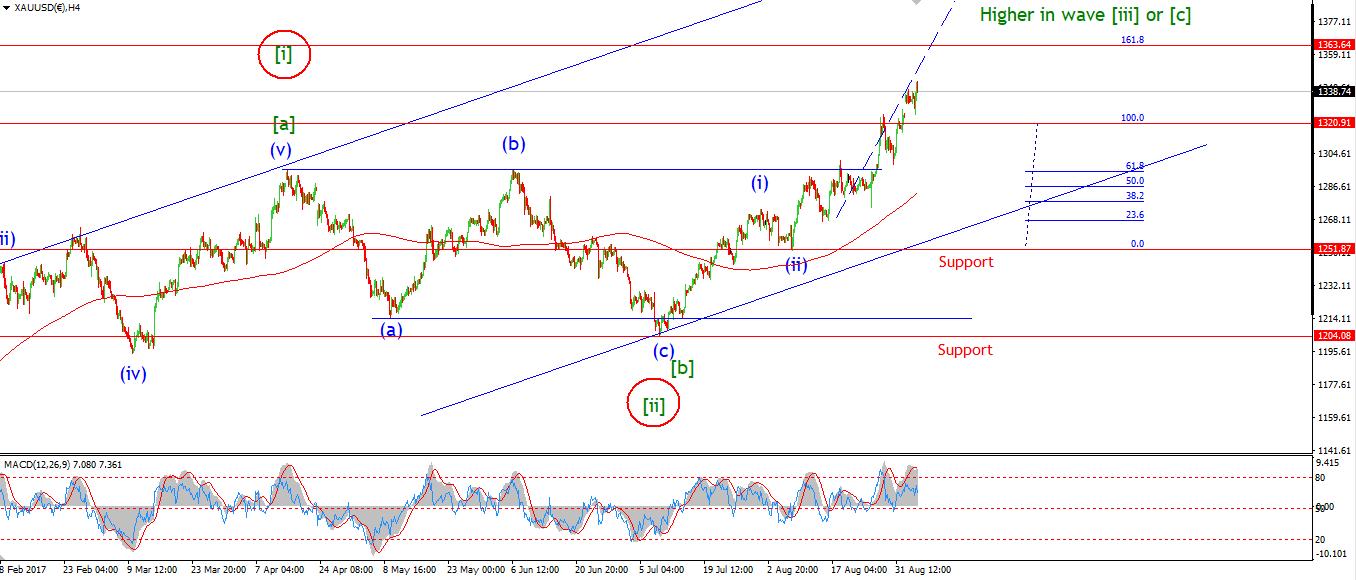
In short, we are ok with any selloff above $1292 , and so is the wave count shown here.
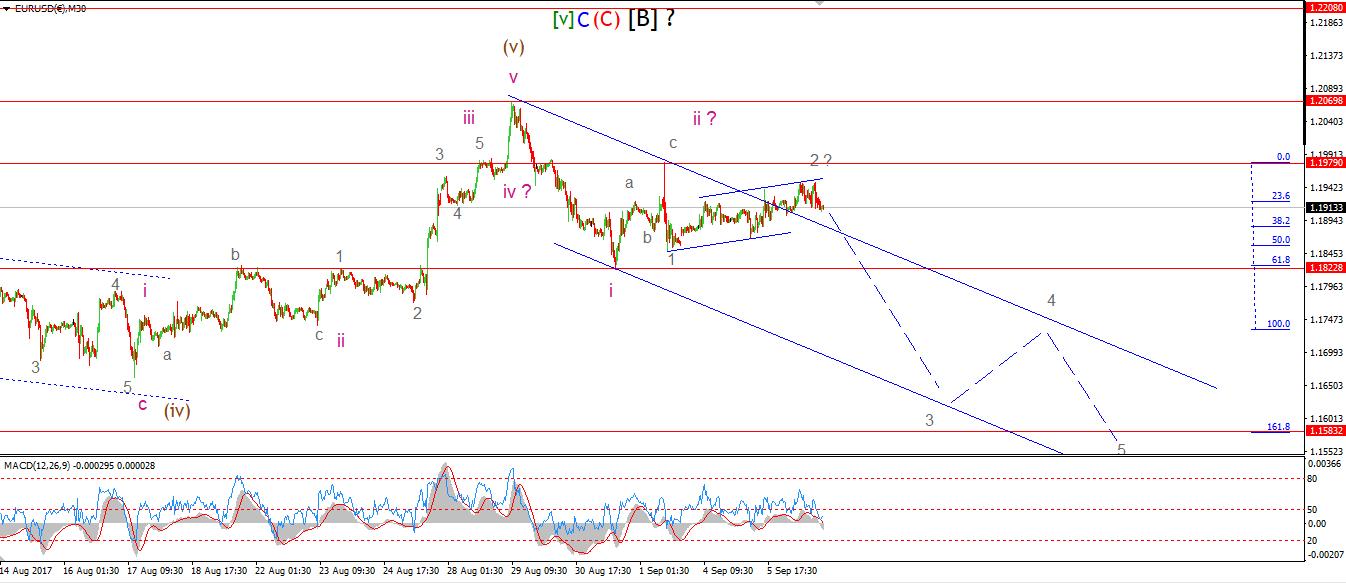
EURUSD
30 min
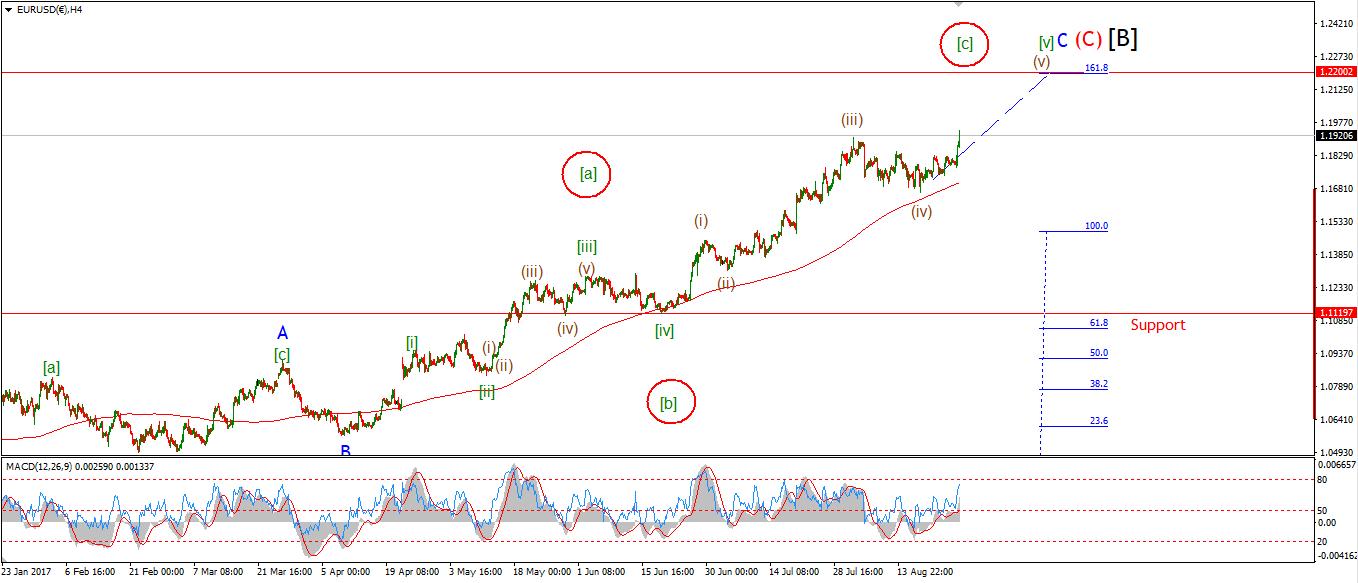
4 Hours
Daily
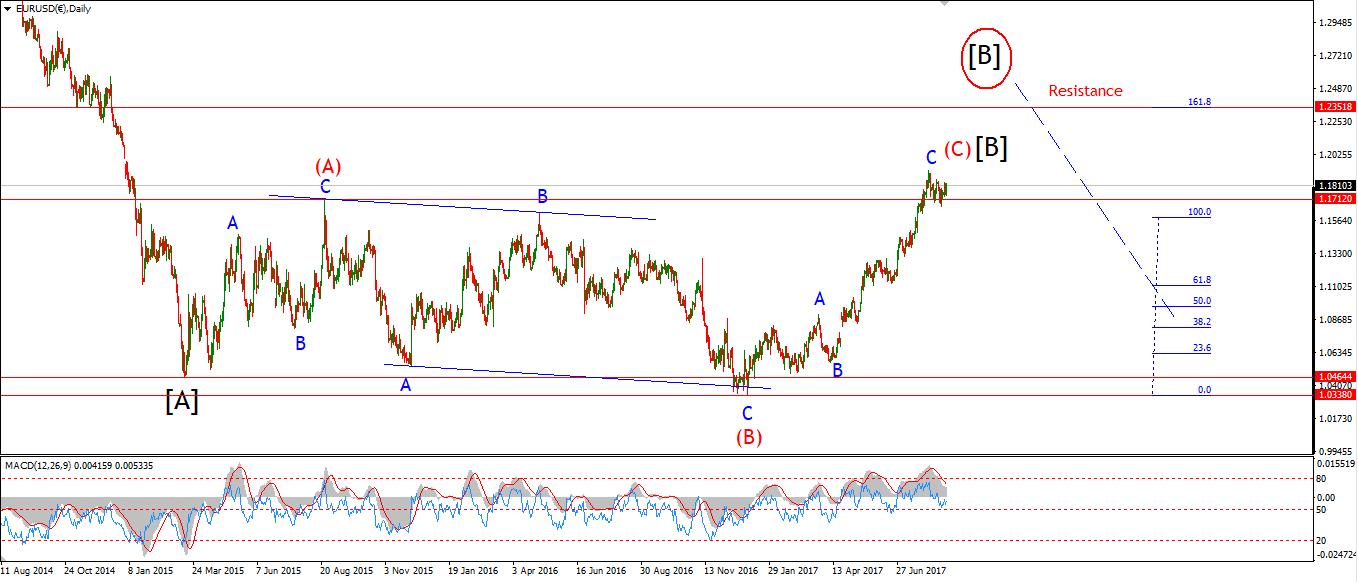
My Bias: long term bearish Wave Structure: downward impulse wave Long term wave count: lower in wave (3) red Important risk events: EUR: Minimum Bid Rate, ECB Press Conference. USD: Unemployment Claims, Crude Oil Inventories,
EURUSD continued a sideways corrective grind today, and is pretty flat on the day. The most fitting interpretation for this short term action is a correction in a second wave, labelled wave '2' grey. The recent high at 1.1979 is key resistance in the short term and should hold the price down.
The wave count now calls for a decline into wave '3' of 'iii'. A decline below 1.1822 will confirm the beginning of wave 'iii' down.
For tomorrow; Watch for a break of the wave '1' at 1.1848 low for the first indication that wave '3' grey has begun. The initial target for wave 'iii' pink lies at 1.1583.
GBPUSD
30 min
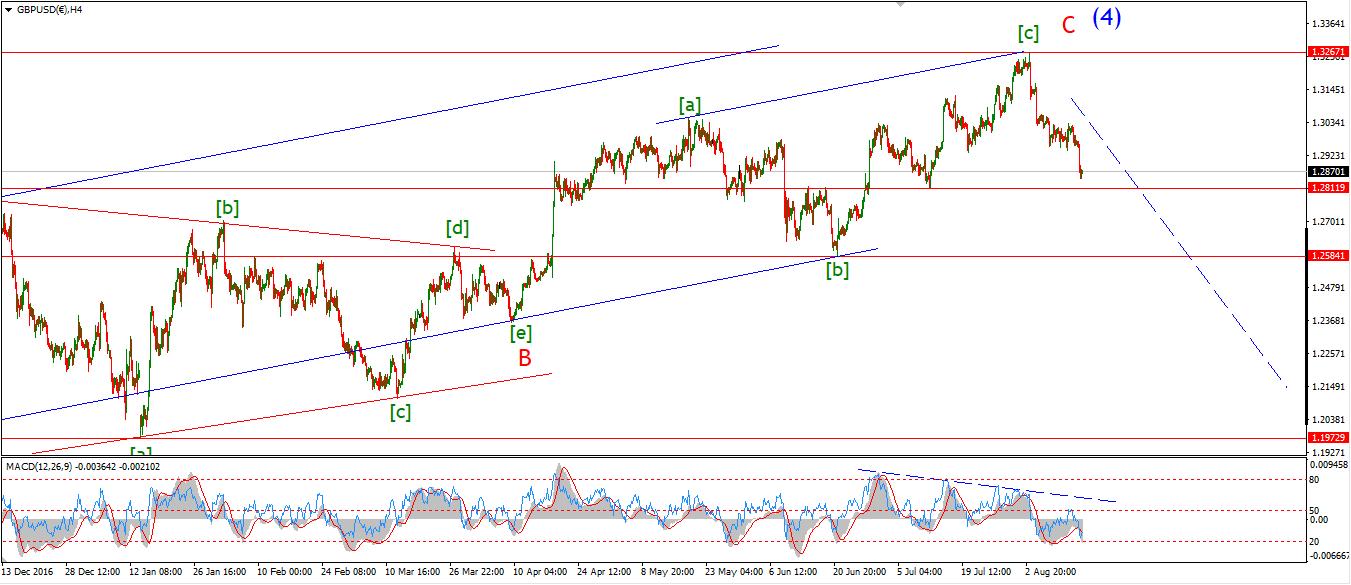
4 Hours
Daily

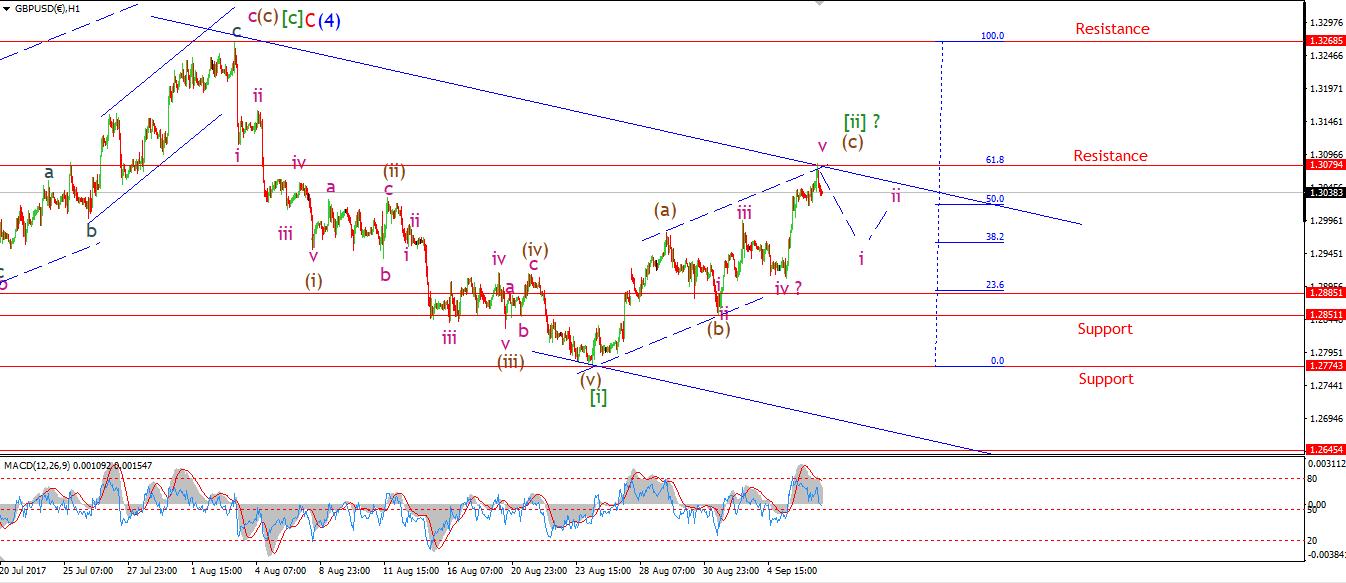
My Bias: short below parity in wave (5). Wave Structure: continuing impulsive structure to the downside in wave (5) Long term wave count: decline in wave (5) blue, below parity Important risk events: GBP: N/A. USD: Unemployment Claims, Crude Oil Inventories,
The high of the day in cable reached 1.3082, three pips above the 61.8% retracement of wave [i] which is at 1.3079. the upper trend line was tagged at the high of the day. The price has dropped off about 40 points since the high also.
Wave [ii] green has now fulfilled all the criteria for a completed correction. Form this point we need to see an impulsive decline and a lower high at a lower degree to lead the market into wave [iii] down.
For tomorrow; I will be looking for that impulsive decline to begin off todays high. A decline through the previous wave (b) at 1.2851 will signal that wave [iii] down has likely begun.
USDJPY
30 min
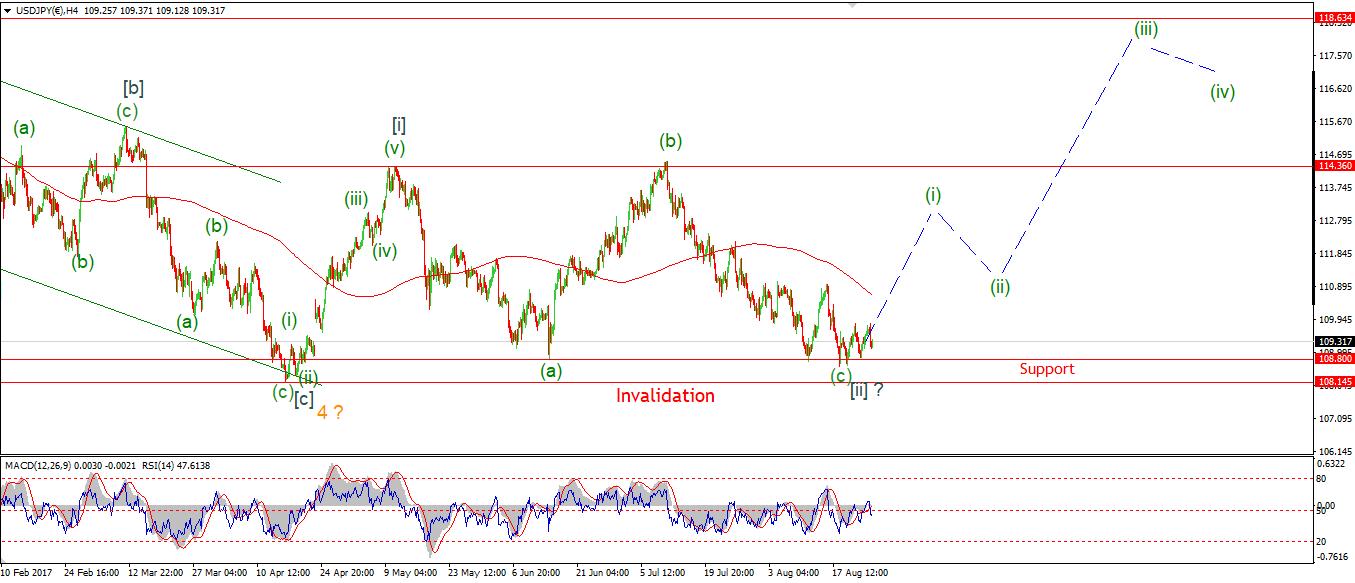
4 Hours
Daily
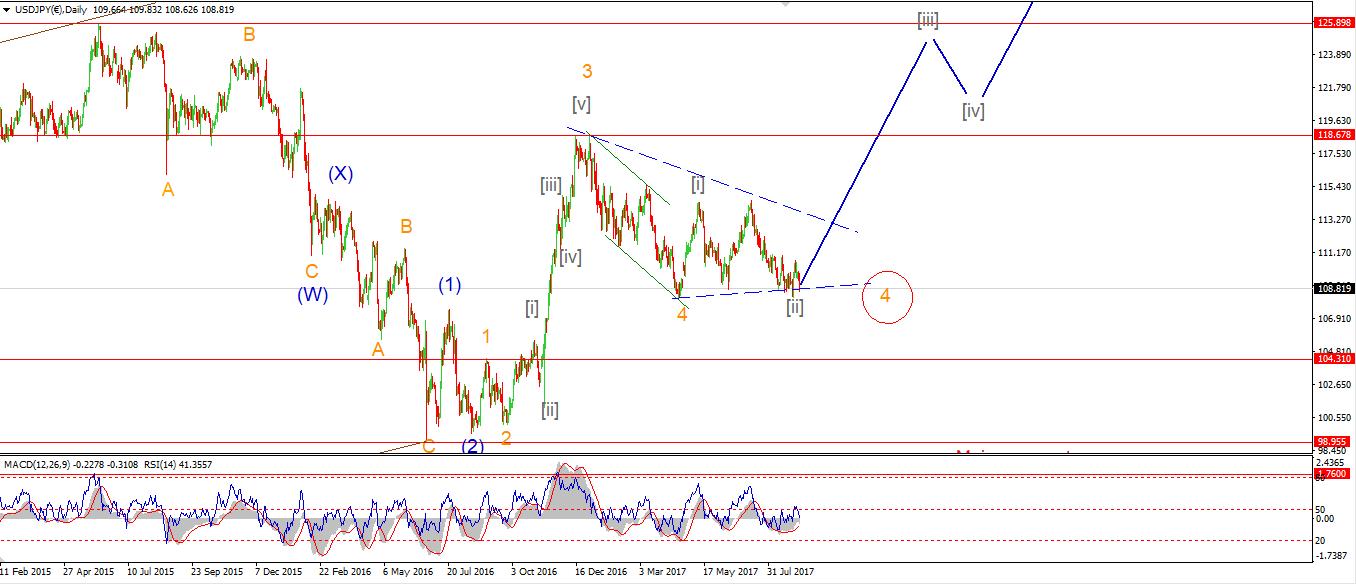
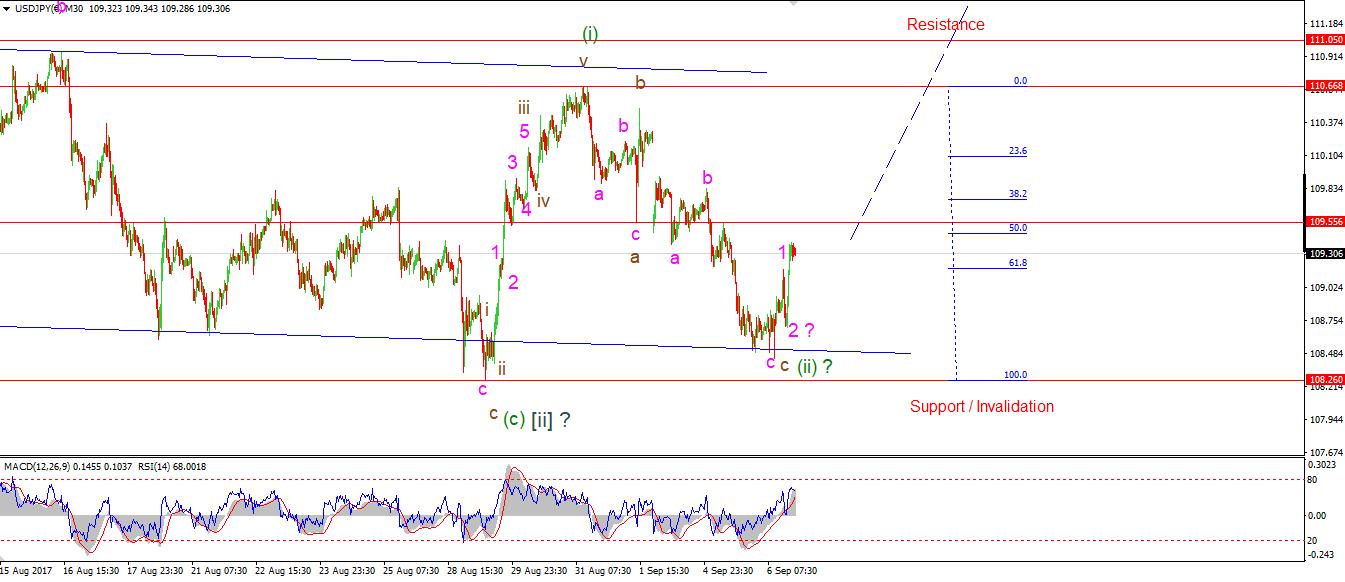
My Bias: LONG Wave Structure: rally in wave [C] Long term wave count: wave [C] is underway, upside to above 136.00 Important risk events: JPY: Final GDP q/q. USD: Unemployment Claims, Crude Oil Inventories,
USDJPY has again bounced out of the fire today. The rise off todays lows is quite impulsive looking but we will need to see if this develops into a five wave pattern to call a bottom in place
If wave (iii) green is to develop off the low at 108.45, It will need a series of higher lows to turn the momentum back in a positive direction again. I will be following this with interest, A five wave form in pink labels will again point to a bottoming market.
For tomorrow; Watch the development of todays bounce. A break above 109.55 will add weight to the idea of a low in place.
DOW JONES INDUSTRIALS
30 min
4 Hours
Daily

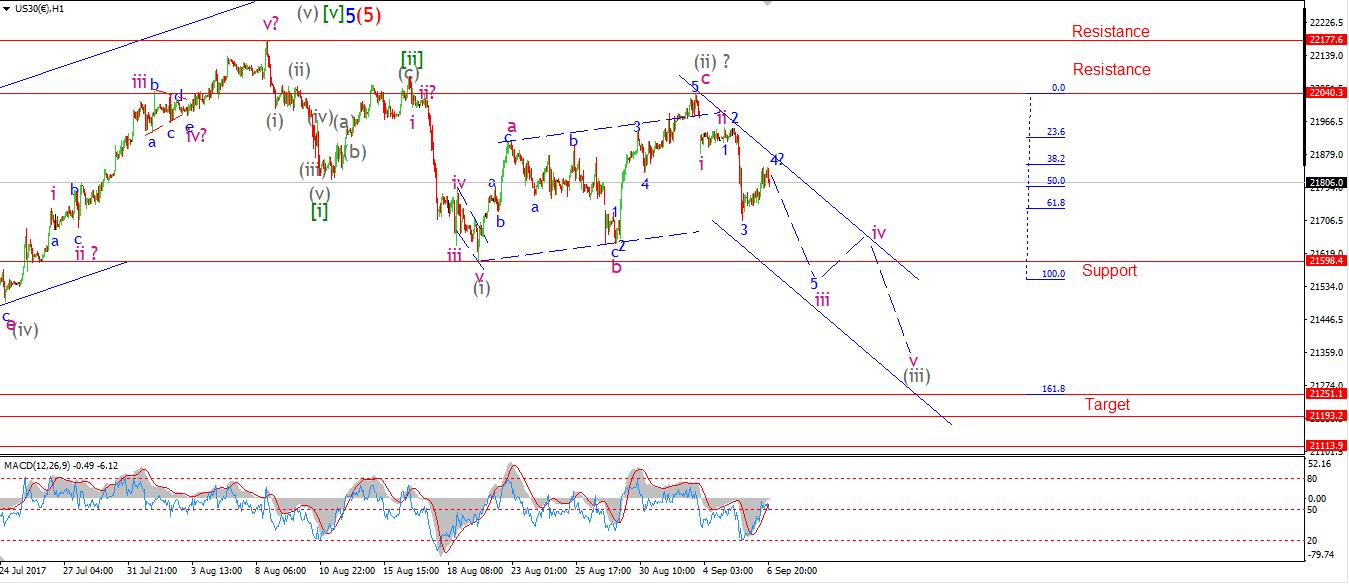
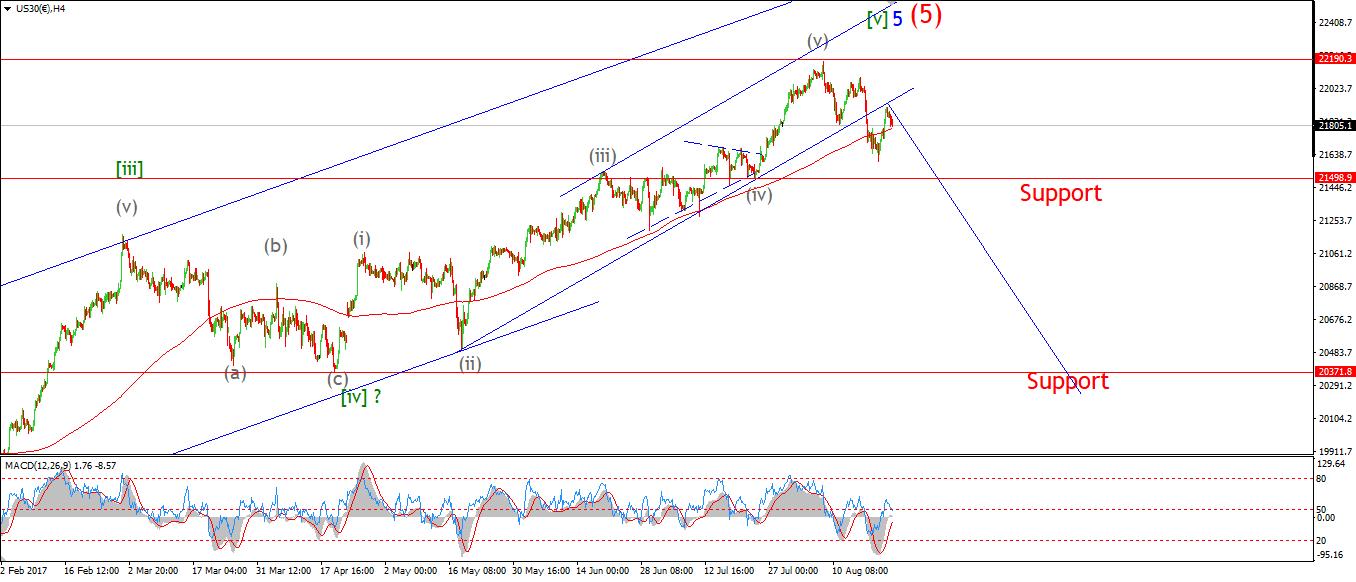
My Bias: market topping process ongoing Wave Structure: Impulsive 5 wave structure, possibly topping in an all time high. Long term wave count: Possibly topped in wave (5) Important risk events: USD: Unemployment Claims, Crude Oil Inventories,
The DOW rose today in a possible wave '4' blue. The wave count now calls for a decline in wave '5' to complete the larger wave 'iii' pink.
This current worrying wave setup is compuonded by the fact that this market that is now at a the most extreme valuation level in over 100 years, when we look at the Shiller CAPE adjusted for corporate profit margins. This level is now higher than the highs at 1929, 1965, 2000 and 2007.
This time is not different, It is the same exact short sighted, overbullish and overbought scenario than surrounded those previous high water marks also. Only this time, We do not have any capacity to jump in and save the day through massive government stimulus. position yourselves accordingly! The longer term outlook is very bleak,
As for the short term wave count; Watch for wave '5' blue to bring the price below support at 21598 to complete wave 'iii' pink.
GOLD
30 min
4 Hours
Daily

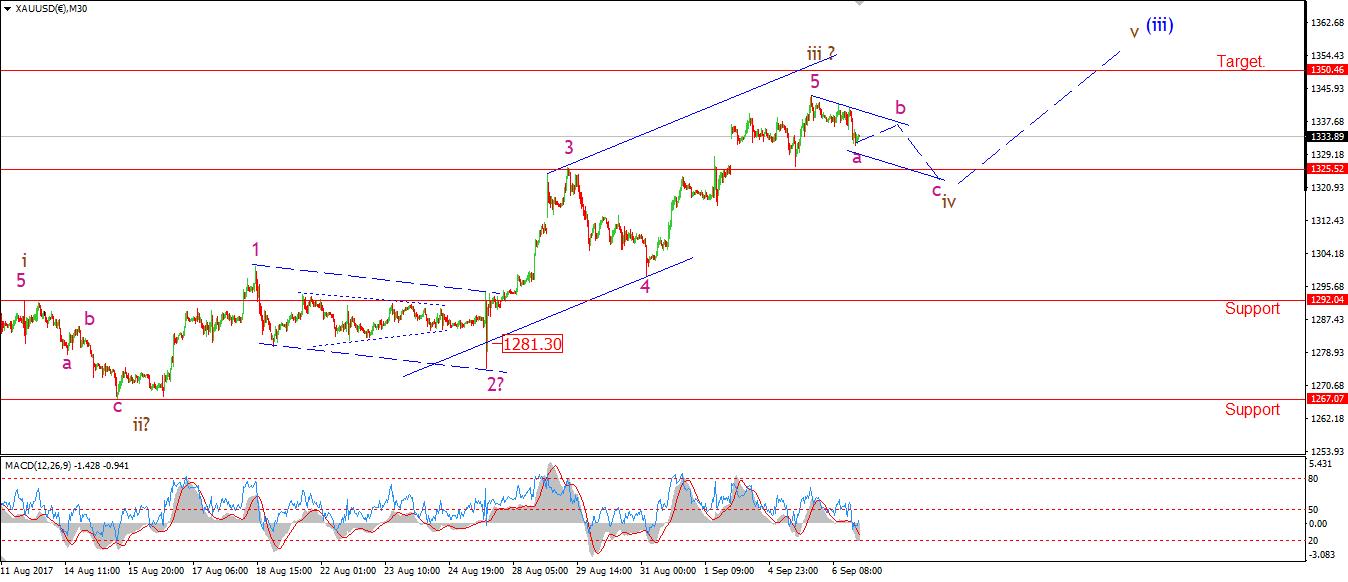
My Bias: Long towards 1550 Wave Structure: ZigZag correction to the upside. Long term wave count: Topping in wave (B) at 1550 Important risk events: USD: Unemployment Claims, Crude Oil Inventories,
GOLD came off the boil today in what could be the beginning of wave 'iv' brown.
the decline so far is in three waves and may have completed wave 'a' pink. The low of wave 'iv' must stay above 1292 to remain a valid five wave structure. So we have a good cushion at the moment.
1325 forms an interesting support level, It has proved an interesting support and resistance level over the last week.
So, For tomorrow; Watch how this current correction plays out, The trend channel offers a good guide as wave 'iv' develops.
Read more by Soren K.Group


