***As we entered the summer months, many investors wanted to believe a terrible time for oil and gas stocks was nearing an end. Now that we’re six weeks into summer, we see that’s not the case.
During the first half of 2017, oil and gas stocks were among the market’s worst performers. The Dow Jones US Oil & Gas Index declined 17%. Some of the more highly levered oil and gas stocks fell twice that much. After such a big fall, value-hunting investors began buying. But last week, we saw that oil and gas stocks are still vulnerable to waves of selling that send them to 52- week lows.
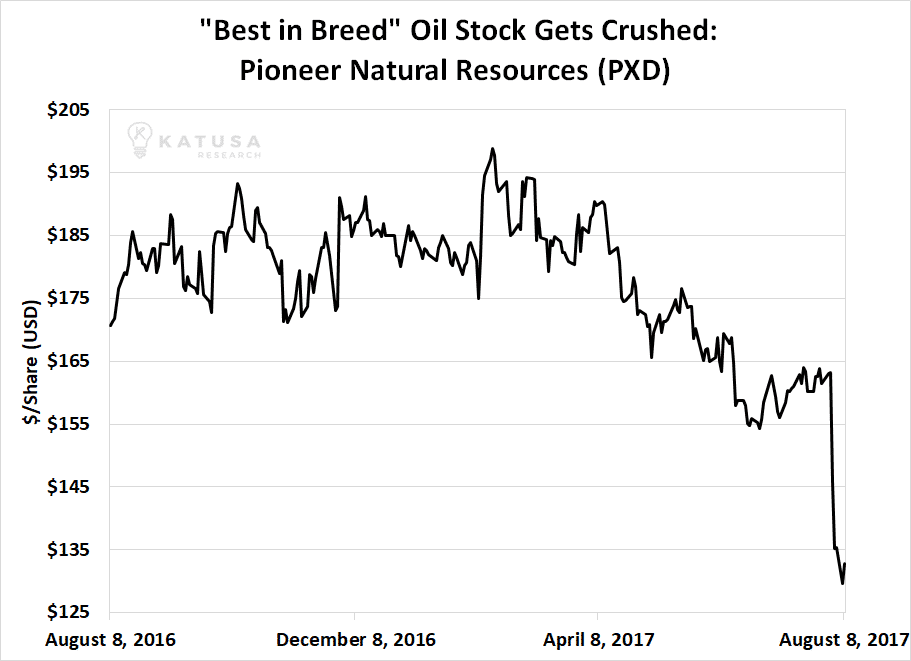
Take Pioneer Natural Resources for example. In the mutual fund and hedge fund world, it’s considered one of the premier independent oil and gas companies… a “go to” stock for getting exposure to the oil sector. After reporting second quarter earnings and stating it would delay drilling projects, Pioneer stock was crushed 17% in the following two days and hit its lowest level of the year. A true wipeout… in one of the sector’s best operators
.
Pioneer is not an isolated case. Last week, a handful of other oil and gas stocks hit yearly lows, including Apache, Range Resources, Southwestern Energy, Parsley Energy, RSP Permian, Sanchez Energy, Carrizo Oil & Gas, and Noble Energy.
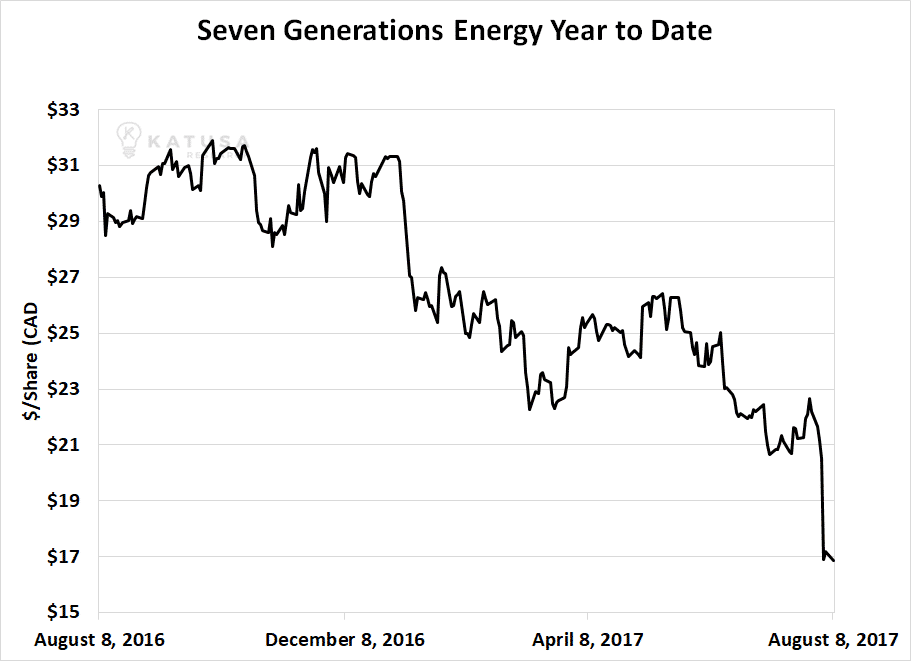
An especially notable loser last week was Canadian producer Seven Generations Energy. It’s a major player in one of my favorite areas for investment, Canada’s prolific Montney shale. It has exceptional assets. However, quality was no sanctuary last week. After reporting second quarter earnings, “Seven Gen” dropped as much as 18% and reached a fresh yearly low.
***Regular readers will recall my writings on the oil patch back in June. At the time, I stated that although the oil and gas sector had suffered massively in 2017, more pain was on the way. Last week’s declines show that my expectations are being met. They are also moving us closer to a significant bottom in the oil sector. I’m getting closer and closer to pulling the trigger on high-quality names marked down to discount prices. More on this to come.
How Index Funds Are Impacting the Gold Sector
Over the past seven years, index funds and exchange-traded funds (ETFs) have dominant forces in the market. Typically, these funds don’t try to beat the market. They are the market. They own broad indexes (like the S&P 500) or sector groups (like retail or energy). And they’ve become widely popular with investors.
Index funds are so popular that many investors are warning about the effects index funds are having on the overall stock market. Since index funds buy stocks based on an index – not good old fashioned fundamental analysis – they have the potential to make popular, overvalued stocks even more overvalued… and warp the market.
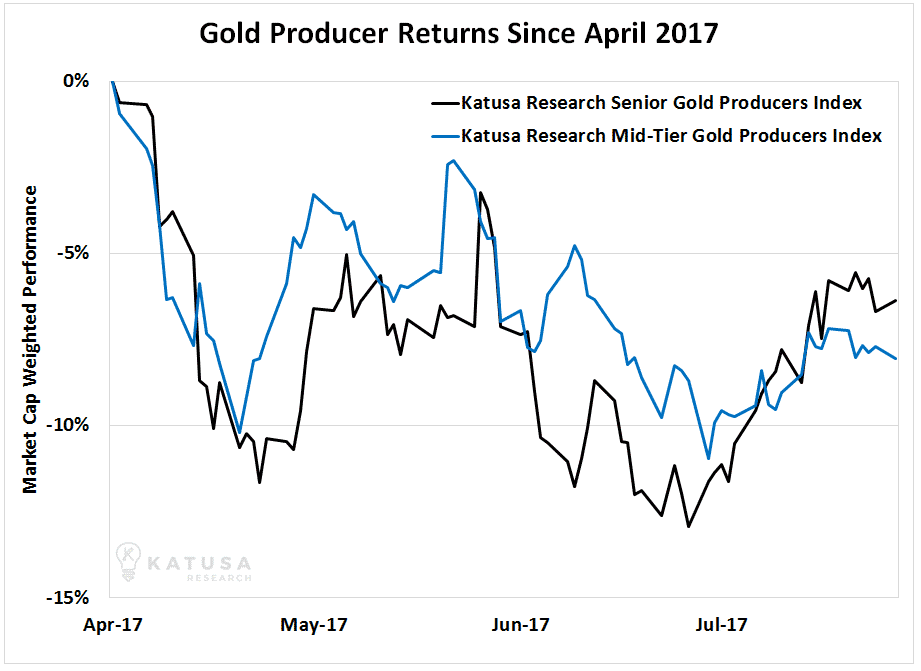
What you may not have heard however, is how ETFs are influencing returns in the gold stock sector. Since spring, the smaller mid-tiers (sub 400,000 ounces of gold production annually) have experienced significant selling which we will explain later. This significant selling of the smaller mid-tiers has lowered the overall mid-tier index relative to its performance to the senior index in past years.
And still true today, as a group, the mid-tiers overall are cheaper than the senior gold producers.
The chart below is the Katusa Senior Gold Index which is made up of the 15 global publicly listed primary gold producers that produced over 1 million ounces of gold in 2016. The senior golds have outperformed the Katusa Mid-Tier Gold Producers which is made up of 25 publicly listed primary gold producers that produced between 250,000 and 1 million ounces of gold in 2016.
There are 15 primary gold companies that are publicly listed that produce over 1 million ounces annually.
There are 25 publicly listed mid-tier gold companies (on all global stock exchanges) that produce between 250,000 to 1 million ounces annually.
The 15 senior gold producers combined produce 34.69 million ounces in 2016, whereas the 25 mid-tier produced a combined 12.4 million ounces in 2016.
The combined market capitalization of the 15 senior gold companies is $130.9 billion. The 15 senior gold producers combined have $38.5 billion in debt. The 25 mid-tier gold producers have a combined market cap of $52 billion and have $12.4 billion in debt.
On average, using a market capitalization value per ounce of gold produced, the senior gold producers index is getting valued $3,773 per ounce of gold produced. On average, the senior gold companies have $1,110 of debt per ounce of gold produced.
The Mid-tier gold producers on average are valued at $4,200 per ounce of gold produced and have $997 of debt per ounce of gold produced.
The mid-tier gold producers have a more disciplined balance sheet than the seniors, as seen by the data above.
But then why are senior gold producers outperforming the mid-tiers?
One reason “big gold” is outperforming “mid-tier gold” is the recent restructuring of the VanEck Junior Gold Miner ETF, ticker GDXJ.
Created in 2009, GDXJ has become a big hit with gold stock investors. For years, it was a one click way to buy a basket of small and mid-tier gold exploration, development, and production companies. Investors reckoned that by holding GDXJ, they get “juice” on the upside, but not the downside risk associated with owning just one or two gold juniors. At one point this year, the fund had amassed more than $5 billion in assets.
This tremendous growth was a problem for VanEck. GDXJ grew too large to own many of the smaller stocks in its universe. GDXJ took in more cash than it could place in small and mid-tier gold stocks. Rather than turn money away, VanEck restructured the fund this year. It sold off some of its smaller holdings and expanded its universe to some larger gold stocks.
In a few cases, GDXJ owned up to 19.9% of many of the producing mid-tier companies. When the GDXJ decided to rebalance, it reduced its exposure in mid-tiers and increased exposure in senior gold names. The resulting selling pressure directly affected the share price of the mid-tier companies (in the short term).
Lesson: Know who the other shareholders of the company you invest in because their decision to sell can directly affect your portfolio.
Regards,
-Marin Katusa
www.katusaresearch.com
Starting from scratch, Marin has built a large personal fortune… all through his ability to find great investments. During his career, he has sat on the board of a public company, arranged over $1 billion in financings, and written the New York Times bestselling book, The Colder War. Marin’s insight has been featured in The Wall Street Journal, The New York Times, Bloomberg and CNBC. He has traveled over one million air miles visiting over 500 resource projects in more than 100 countries.
Unlike some financial firms, Katusa Research does not accept money from companies in return for coverage. We turn down all offers of kickbacks, brokerage commissions, and referral fees. We have no hidden agenda and we are not for sale. We work for our subscribers, not advertisers. And the investment guidance we provide is the guidance we follow ourselves.