- U.S. Treasury Yields Are Declining
- This Bodes Well for Gold Prices
- Gold and U.S. Treasury Yields are Negatively Correlated
Fear over global trade negotiations, and recent softer than expected economic data has weakened the long end of the U.S. treasury curve, which should be a positive for gold prices. Historically as the long-end of the U.S. treasury curve declines, relative to European and Japanese yields, the dollar moves lower which paves the way for higher gold bullion and silver bar prices.
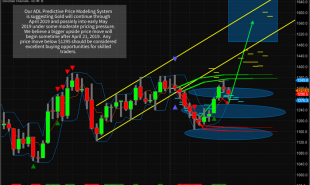
Yields have been under pressure since pushing up to the 2.95% level, following the Fed’s decision to increase interest rates by 25-basis points following their March monetary policy meeting. Investors appears to be unsure of the Fed’s forecast that yields will accelerate higher in 2019 and 2020. A declining 10-year treasury yield is the markets way of telling the Fed that your forecast for growth and inflation are too rosy.
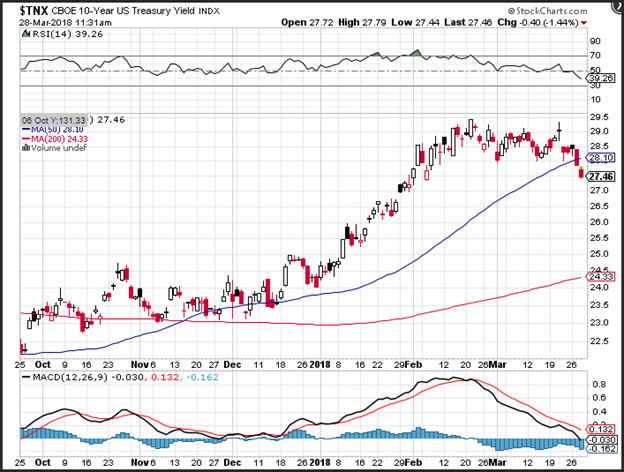
The chart shows that yields surged higher in 2018 rising from 2.45% to 2.95%, but now are on their way back down to earth. The yield has slipped through the 50-day moving average which it held above since mid-December of 2017. The yield could easily retrace back to support near the 200-day moving average which is where the 10-year treasury yield began 2018.
How Does a Declining Treasury Yield Effect Gold Prices
Interest rates are a key component to the value of a currency as well as the value of gold. Since gold is quoted in U.S. dollars, a stronger dollar makes gold more expensive in other currencies, which can weigh on the price of gold bullion.
Interest rates are a driving factor in the currency markets as a higher relative yield makes one currency more attractive than another. For example, if you believe that interest rates will increase in the U.S. relative to Euro, then you will earn more by holding dollars by earning the higher yield. With the yield on U.S. treasuries moving lower, the relative value of holder dollars becomes less attractive. If this lower the value of holding dollars, then the value of gold will increase.
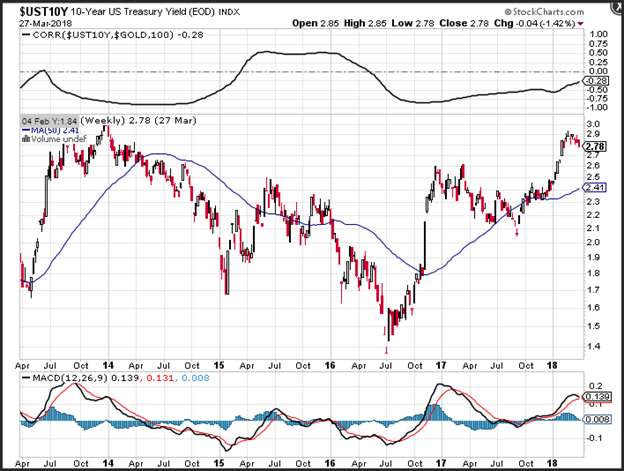
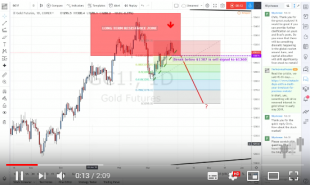
The chart above is an analysis of the U.S. treasury yield relative to gold prices. The chart is a weekly chart of the 10-year U.S. treasury, and the upper chart is a graph of the weekly correlation between gold prices and the U.S. 10-year treasury. A correlation analysis describes how likely 2 or more instruments will move in tandem. The key factor is the correlation coefficient. The range of correlation coefficient are from 1 to negative one. A correlation of 1 means that the two items move perfectly in tandem while a correlation coefficient of negative 1, means that the two items move perfectly in opposite directions.
The average weekly correlation between U.S. Treasuries and gold prices is -60%. This means that most of the time, the two objects move in opposite directions. You can also see there are times they move in the same direction, which happened during the 52-week period between mid-2015 and mid-2016. The negative correlation has been as low as -94%.
Summary
U.S. yields are on the decline which could be beneficial for gold prices. When U.S. yields decline relative to other country yields, the dollar declines in value. A weaker dollar is generally beneficial for gold prices, as gold bullion is quoted in U.S. dollars. There is a negative long-term correlation between U.S. treasury yields and gold prices, which means that a declining 10-year yield will likely buoy gold bullion prices.
If you are interested in taking advantage of a declining treasury yield and higher gold prices click on this link to get access to your Investment Kit or better yet, give us a call today at 800–982–6105.
Good Investing,
Treasure Coast Bullion Group
Read more by Treasure Coast Bullion Group, Inc - Staff Writer