The Trend Retains the Name
Intro by Vince Lanci and Bon Scott for Soren K. Group
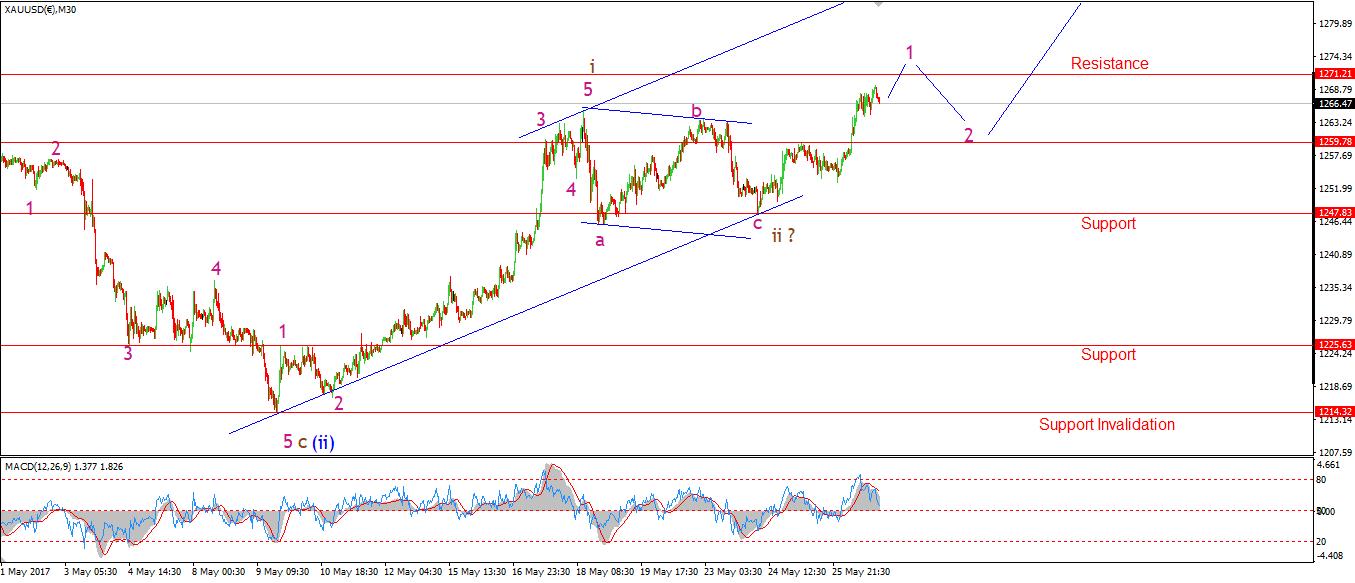
The pattern continues in Gold, with last week's move reaffirming the wave count Enda is using below. Friday's rally puts the market right above the high on the 30 minute chart established in the previous "5". The next "1" would be completed if gold pierced the $1271.21 level. After that, any retracement that holds $1259.78 further confirms a wave seeking final extensions to the $1550 area. A drop below $1247 at this point puts into question the pattern, but does not negate it.
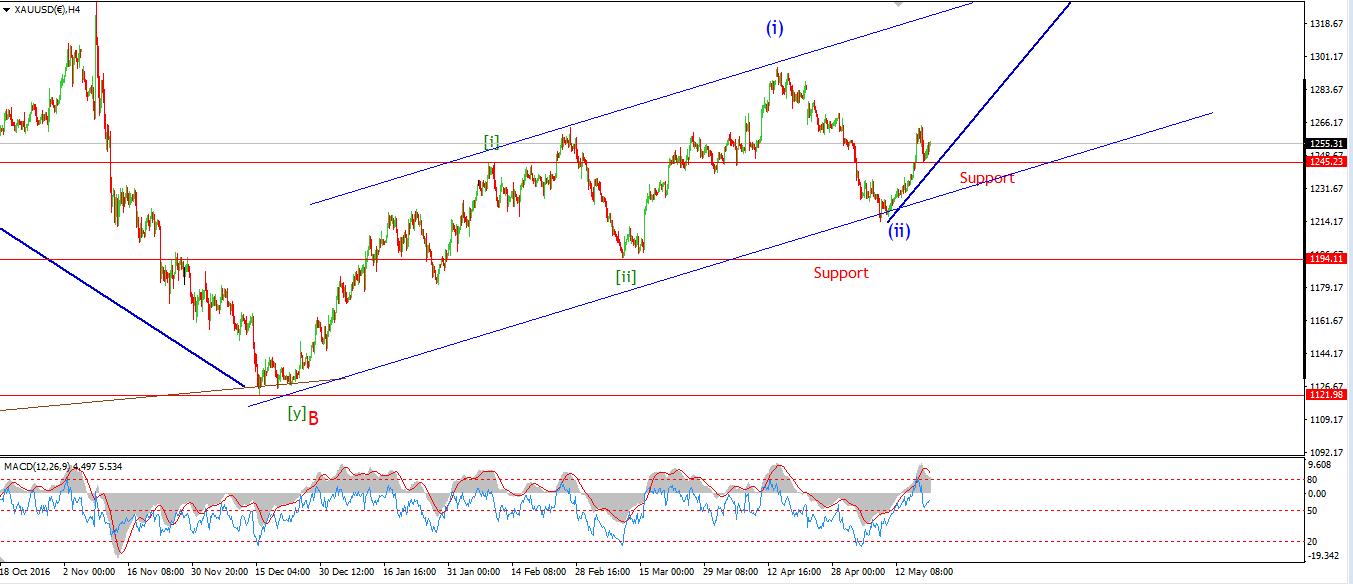
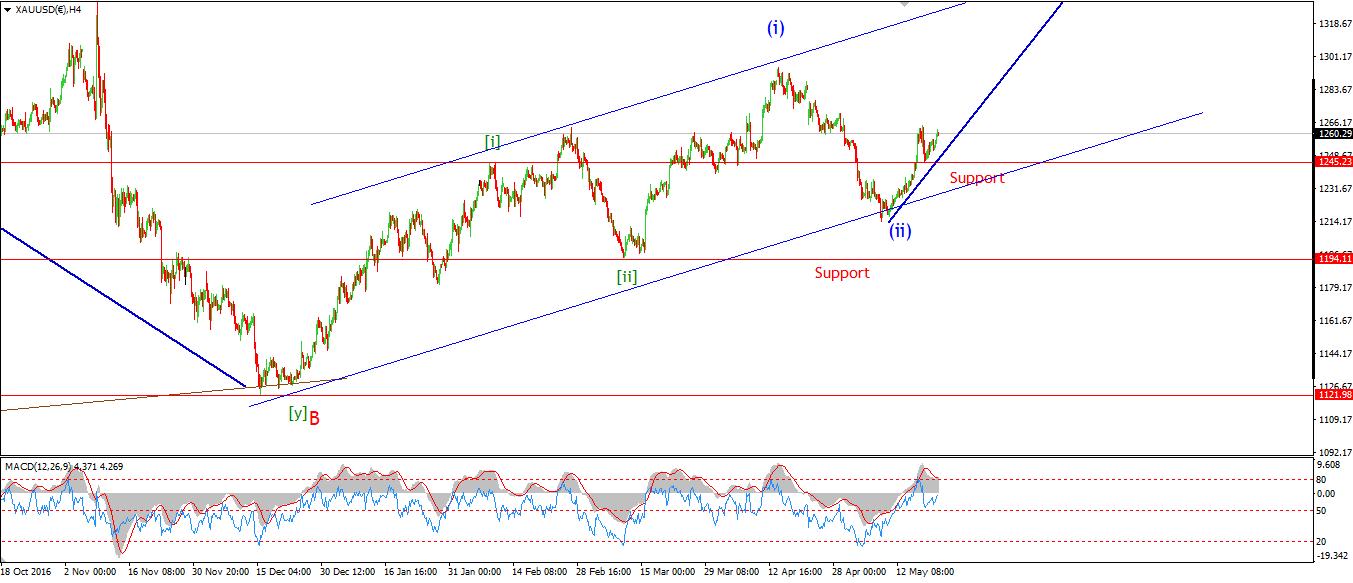
The 4 hour chart shows a nice traditional channel with an upward bias that also respects the counts described. Note the steepness in the rally in that chart. Impulsiveness is in play now. To clarify, we identify "impulsiveness as a negative describing momentum chasing funds. But the term is not being used the same way here. The author is describing a market that is following the path of least resistance; which right now is higher. This does warn of equally violent pullbacks, but until the wave count is put into question below $1247 the short term and long term bias are aligned.
The daily chart shows the macro goal of this pattern: a "corrective" high in the $1550 area. Nothing new here. But that is what bulls want right now. And they are getting it.
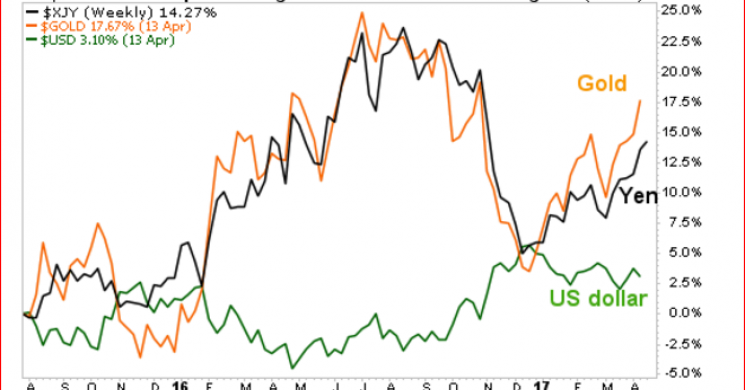
GBPUSD, JPY, and Gold Walking Hand in Hand?
Other currencies are lining up to corroborate the count here as well. As her title implies, a GBPUSD high is potentially indicative of an acceleration in Gold. We are fans of JPY behavior when it comes to Gold correlation. Note the similarities at the 30 minute and daily charts of the Gold and the JPY below in the analysis. Here is a quick overview.
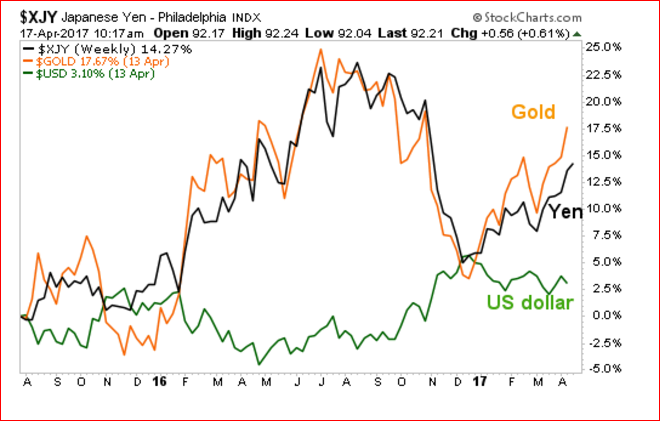
Why is this? There are several potential reasons for the eerie parallel between JPY and Gold. One simple one is this. In Asia, the JPY is viewed as the most stable regional currency. The Yen is viewed as the USD of the far east. So when Chinese and other Asian players seek safety, the buy Gold and Yen as well as USD if the crisis is EU based. We feel as the Asian Cartel picks up more strength and the USD Petrodollar becomes less powerful, this JPY/ Gold positive correlation will strengthen more.
Enda's GBP/USD noted pairing is just icing on a Golden cake to us. But we are happy to now see it. - SKG
First a disclaimer: ElliotWave Analysis is subjective. As we have said before; we are huge fans of it but have a hard time finding an analyst who is OBJECTIVE about their own Bias. As our namesake Soren Kierkegaard said:
While objective facts are important, there is a second and more crucial element of truth, which involves how one relates oneself to those matters of fact.
Enda Glynn is one who fits that crieteria. Not dogmatic, yet not pretending she is "neutral".
So, when a level is violated and Gold does reverse (no whammies!!), do not dog-pile the analyst. We are sure her chart counts will adjust. EW is a probability engine. And Enda is upfront about her bias. While we do not expect her to cry in her cornflakes if Gold's count changes, we do expect her to be quick to acknowledge a market changing.
She is not selling software, she is not proposing you give her money to manage, she is a true technician. That itself is not easy to find these days. So visit her site. Capisce?
-Soren K. Group
GBPUSD top in place, GOLD ready to rocket?
by Enda Glynn of BULLWAVES.ORG
GOLD - 30 min
4 Hours
Daily
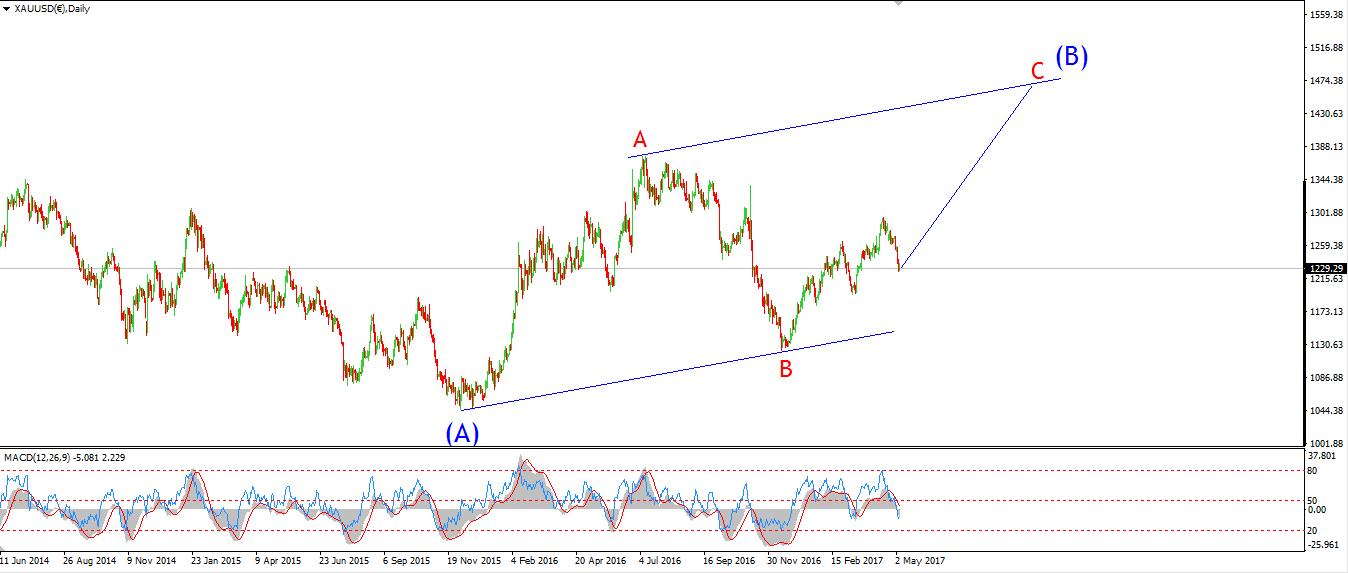
My Bias: Long towards 1550 Wave Structure: ZigZag correction to the upside. Long term wave count: Topping in wave (B) at 1550 Important risk events: USD: N/A.
Today's rally in GOLD has triggered the alternate wave count for wave 'ii' brown which I had spoken about. That means wave 'ii' brown traced out a running flat which bottomed at 1247. The rise off that low now has a nice impulsive look to it, and one more push up would break the resistance level and create a clear five wave form off the low. That type of action would complete wave '1' pink. Wave '2' pink should find support at 1259. Any break of 1247 form this point will signal that wave 'ii' brown was extending into a more complex form.
For early next week, watch for a break of 1271 to prove the bullish case.
Thats it for this week, I wish you all a happy and peaceful weekend.
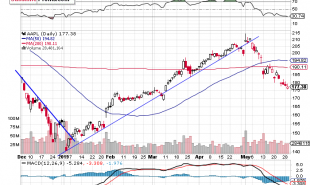
GBPUSD
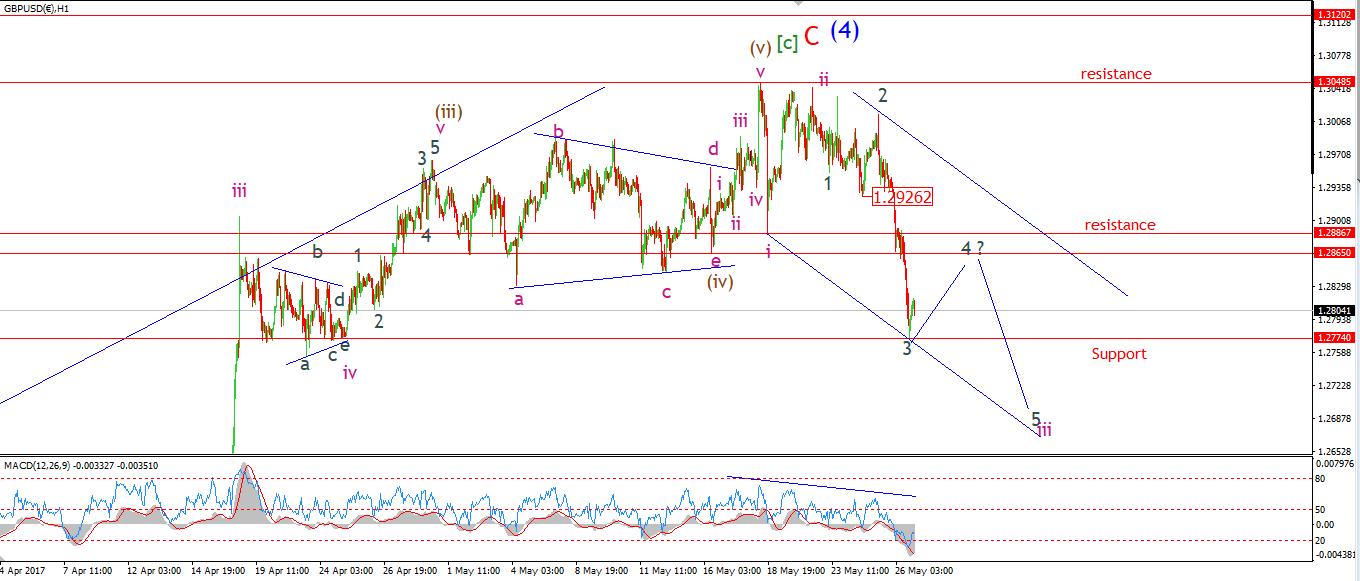
30 min
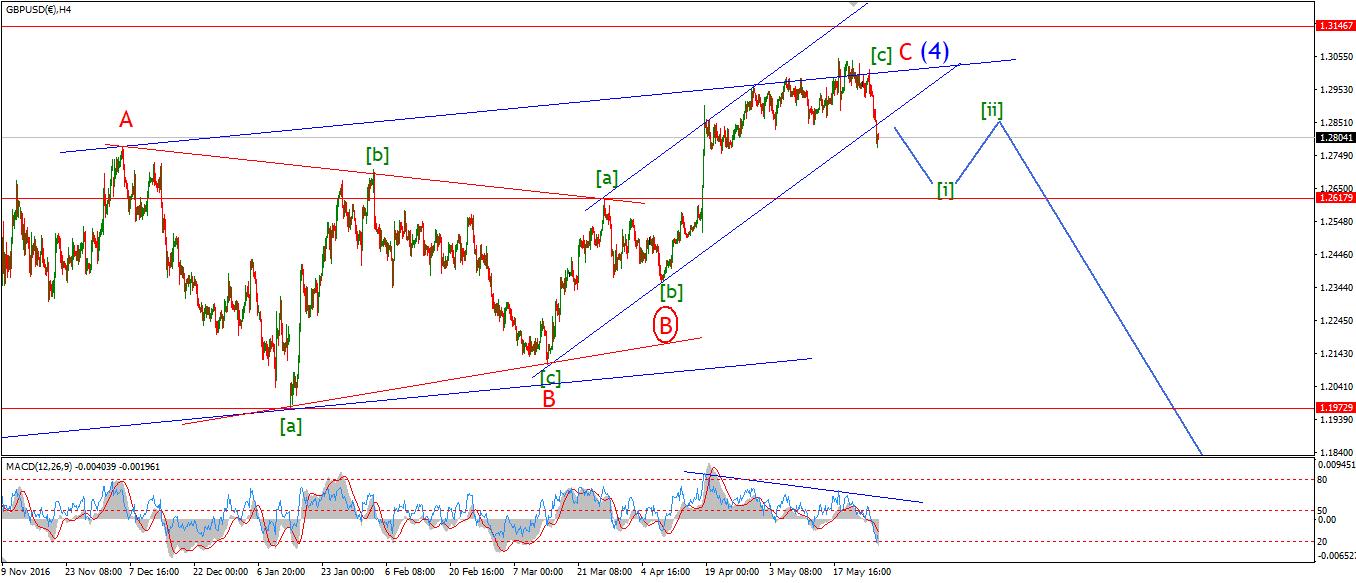
4 Hours
Daily
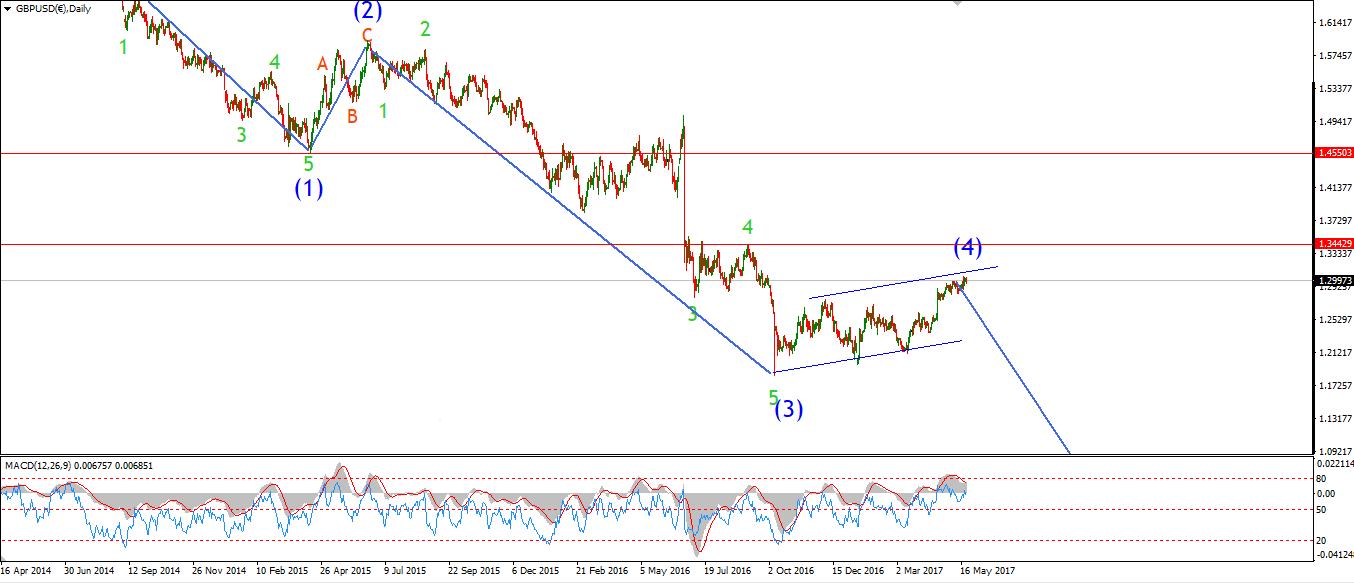
My Bias: short below parity. Wave Structure: continuing impulsive structure to the downside in wave (5) Long term wave count: decline in wave (5) blue, below parity Important risk events: GBP: N/A. USD: N/A.
Well! The market finally gave us the action which the main wave count had called for. That is an impulsive decline in a possible wave '3' grey and a break of that important support line at 1.2865.
The focus has now fully shifted to the downside, and the beginning of a renewed downtrend in wave (5) blue. The indesision in the wave pattern over the last few days was resolved with a very impulsive third wave down.
Wave '2' grey traced out a running flat correction, a wave which is always throws the cat amongst the pigeons! At the moment I can count five waves complete 'within wave '3'. For next week we should get a three wave correction in wave '4' grey and wave '5' grey will likely decline into the trend line once more. Support at 1.2865 now becomes a significant resistance level and should hold the price down for now. Look for wave '4' grey to complete below 1.2865 on Monday.
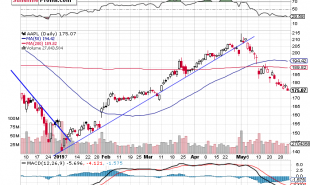
USDJPY
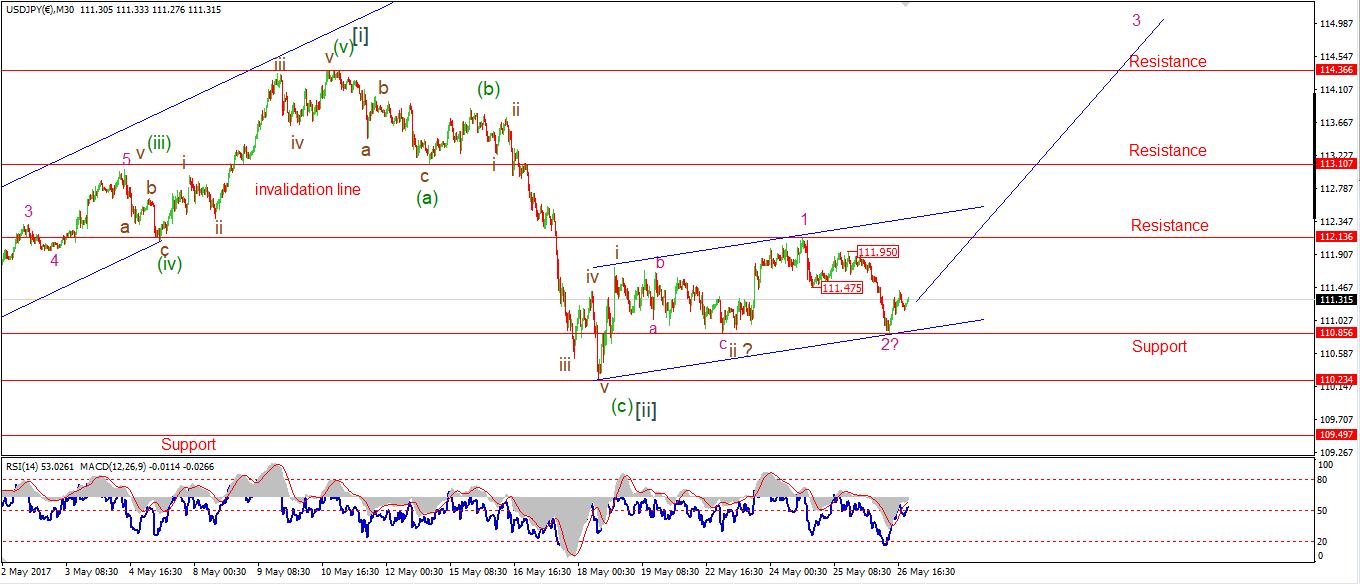
30 min
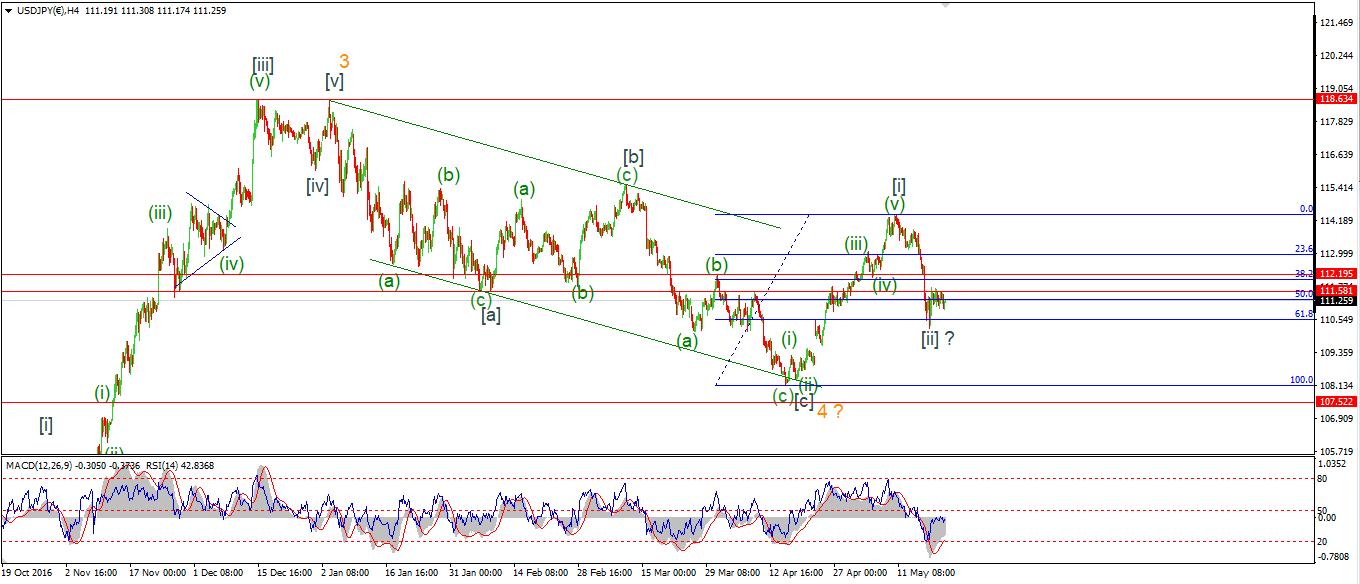
4 Hours
Daily
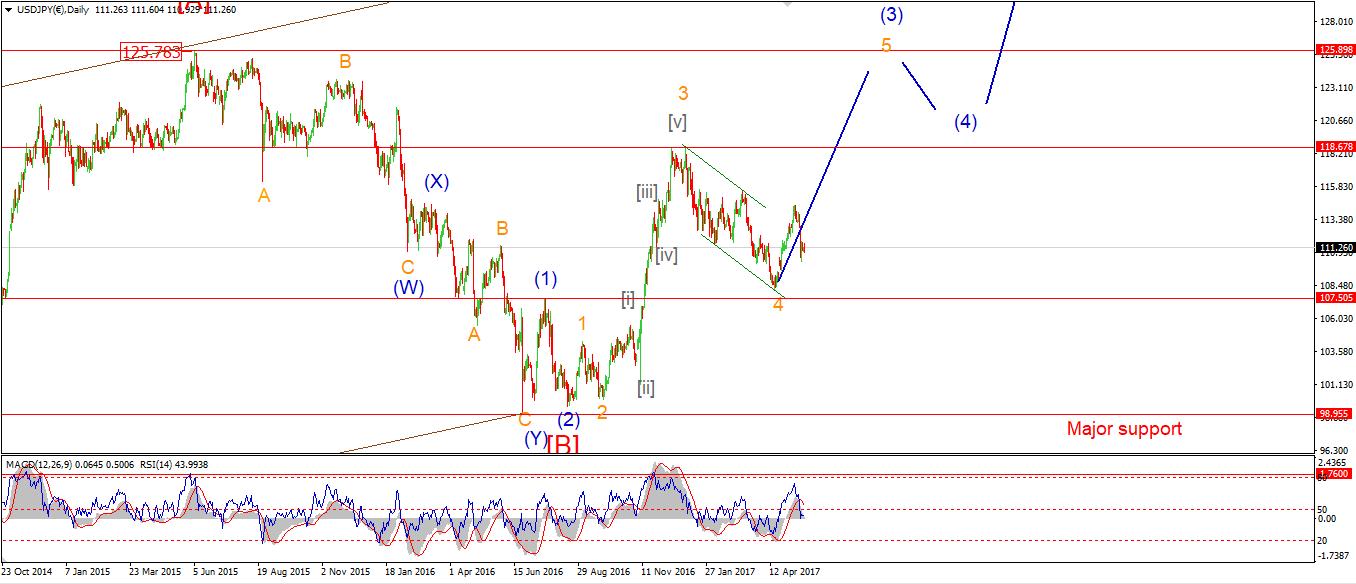
My Bias: LONG Wave Structure: rally in wave [C] Long term wave count: wave [C] is underway, upside to above 136.00 Important risk events: JPY: N/A. USD: N/A.
Despite further declines today in USDJPY, The price did not take out the support at 110.85 which leaves the bullish short term wave count intact. Today's decline completes a three wave form off the recent high labeled wave '1' pink.
The current wave count still calls for a major rally in wave '3' pink, and the support is at that wave '2' low of 110.85. If the price breaks 111.95, then wave '3' will likely be underway. A break of 111.47 strengthen the bullish case in the short term. In the early trade next week, watch for the key support at 110.85 to hold, and a break of 111.47.
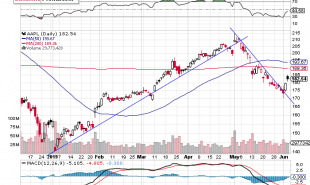
DOW JONES INDUSTRIALS
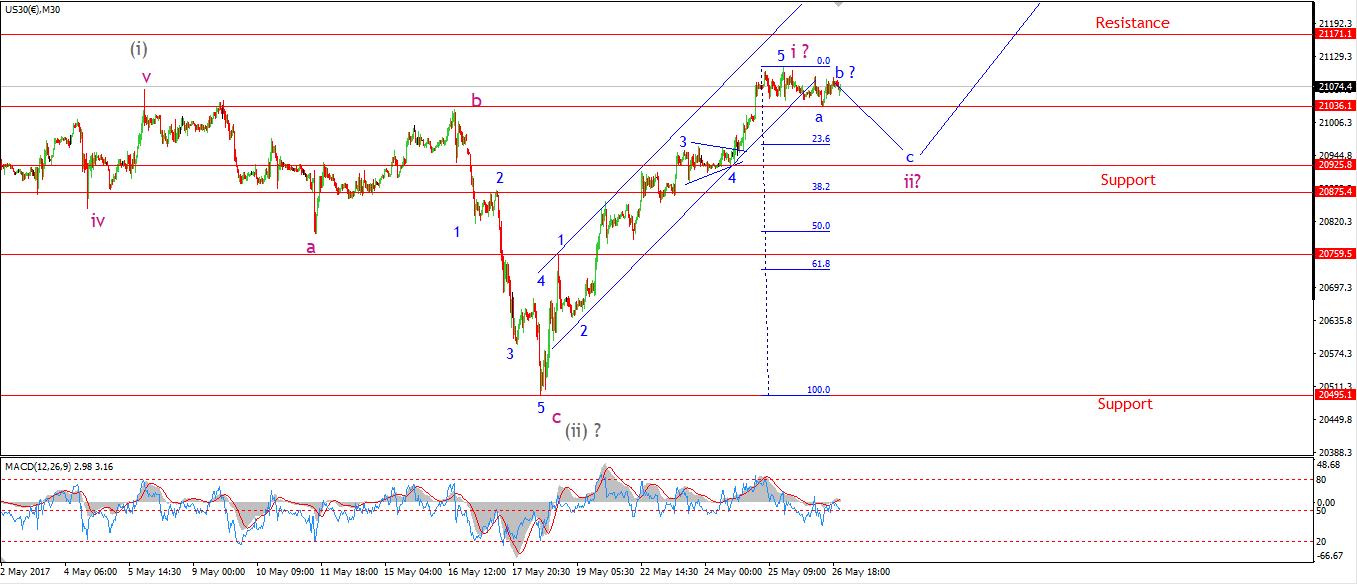
30 min
4 Hours
Daily
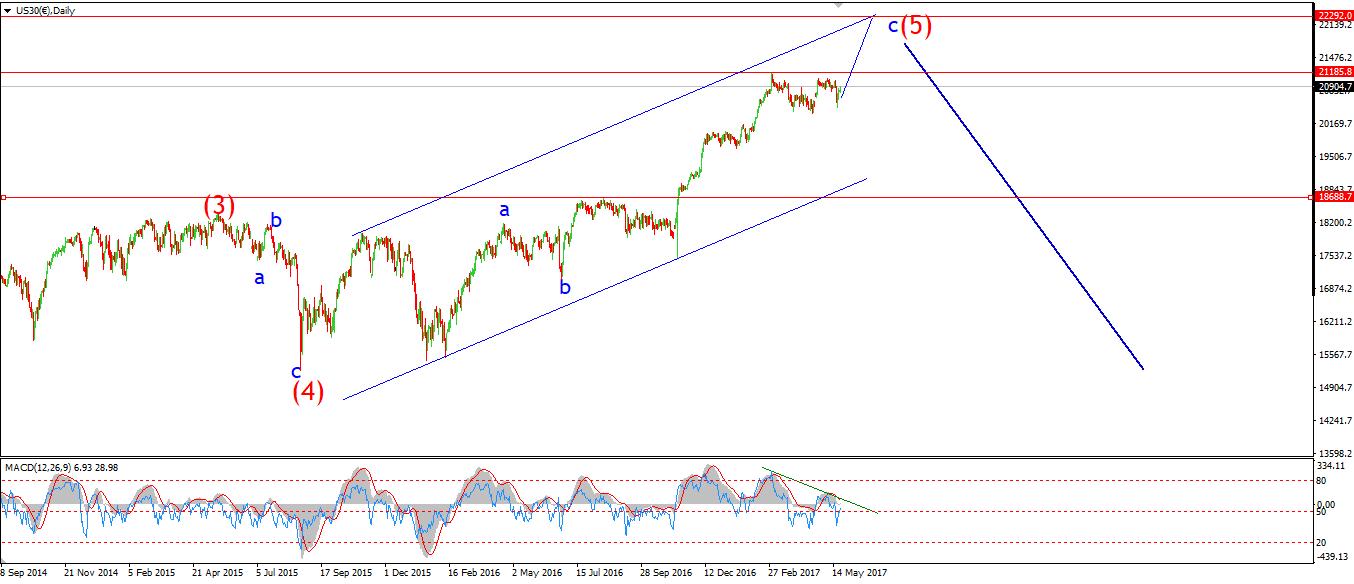
My Bias: market topping process ongoing Wave Structure: Impulsive 5 wave structure, possibly topping in an all time high. Long term wave count: Topping in wave (5) Important risk events: USD: N/A.
The DOW is now moving in a corrective pattern, possibly in wave 'ii' pink. I have labelled the short term chart as a complete wave 'a' and 'b' in blue. That leaves wave 'c' blue to the downside to finish off wave 'ii' pink.
I have marked 20925 as the initial target for wave 'c' blue. This is the low of the previous fourth wave. 20875 marks the Fibonacci 38.2% retracement level.
For Monday, a break of 21037, the wave 'a' low will signal wave 'c' has started. The low at wave 'ii' pink offers the next best opportunity to enter long.
It is Memorial Day on Monday, and U.S market is closed, the London market is closed also for the summer bank holiday. So, I will see you all again after the close on Tuesday the 30th.
More analysis HERE
Good Luck
Read more by Soren K.Group