The research team at ActiveTradingPartners.com is constantly searching for leading indicators to assist our members in finding the best opportunities in the markets. For weeks we’ve been warning of “caution” in the markets as this recent move higher has been fraught with concern by our technicians and researchers. We believe this recent move is based on a theory that global capital is attempting to rally into selected US equities as the only suitable environment for gains and growth. But we also realize that a realistic understanding of market function would dictate that some level of correction or price rotation would be very healthy for the US and global markets.
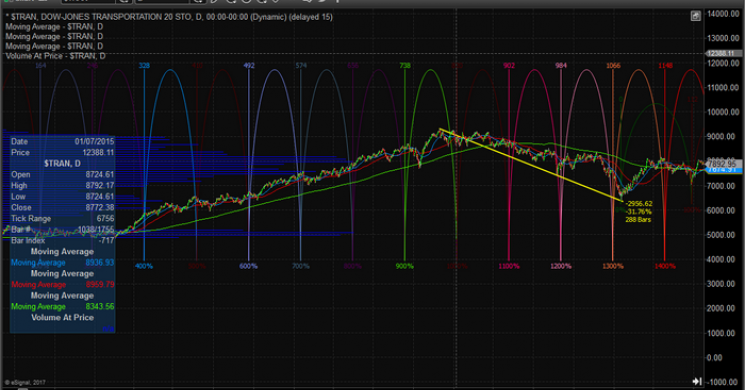
Take a look at a chart of the Transportation Index prior to 2016 (the US election year). Prior to this year of concern and turmoil with a US presidential election, the US experienced a series of Quantitative Easing measures and support from the Federal Government to drive markets higher and higher. Still, the price cycles existed to show us hints as to when and where we could expect market peaks and valleys.
You can see from this chart a series of HIGH CYCLE PEAKS between 2013 and 2015 rotated to a series of LOW CYCLE TROUGHS in early 2015. This rotation from “new price highs” to “new price lows” is indicative of traditional Fibonacci theory. Price must, and will always, attempt to establish a new price high or low at all times. Therefore, this rotation from new price highs to new price lows was a clear indication of a rollover in the Transportation index which coincided almost immediately with a stagnation in the US Majors followed by a series of deeper corrections near the end of 2015 and in early 2016.

How is this relative to today? Well, lets take a look at a current Transportation Index Cycle Chart…
The current Transportation Cycle Chart (2017) has shown rotation from “new price highs” to “new price lows” with each recent cycle event. Prior to that, early to mid 2016, the cycle price structure was Low to Low. It is our believe that the current cycle structure will drive the Transportation Index much lower, possibly by as much as -20%, over the next 3~5 months while driving the US Majors into a deeper and deeper price correction.

It is our belief that the critical level for these cycle patterns would be the recent lows in the Transportation Index, near 9000. The current price level is only about 500 pts away from this level and the average Daily range of the Transportation Index has been near 70+pts (roughly 0.5%~1.25%). Based on our estimates, the Transportation Index could reach the 9000 level within a week or two. This is the first level of concern for our research team because a deeper correction would likely see the Transports move quickly to below 8500.
Our estimate target is a move to near 7500~7800 on or before April 2018.
This will resolve as deeper and more aggressive price correction in the US Major markets that should equate to nearly the same relative price decline. For example, the NQ rotated nearly -19% lower in 2015~2016 on two instances correlated to the deeper declines in the TRAN. We are predicting that any deeper rotation in the TRAN will result in equally and potentially very violent corrections in the US Majors over the next 4+ months.
Taking a look at the DOW, we believe the US majors are setting up for a fairly deep and violent correction over the next 4~12 weeks to move more in unison with the Transportation Index. The Transportation Index has already fallen by nearly -6% within the last 30 days or so. Any further decline (near to or beyond -10%) could potentially break the bullish trend in the Majors and result in the start of a broader market correction within the 5~10% range.

Remember, back in 2015~2016, the Transportation Index fell nearly -22% and the NQ fell in unison with the Transportation Index a total of two times in the range of -20%. What would it take for the US Majors to move inline with the Transportation Index if it continues to fall? We believe the correlative move in the US majors is inevitable as long as the Transportation Index continues to rotate lower. We believe the -9% to -11% range in the Transportation Index will open the floodgates for heavy selling.
A quick review of the NASDAQ (NQ) shows similar Cycle patterns and a potential cycle event near February 9, 2018 with a target of June 2017 lows near 5600 (-11.57%). Remember, these cycle events could correlate with a bigger and deeper move, we are simply trying to be conservative with regards to risk and scope of the moves. Should the Transportation Index fall beyond -12% quickly and continue to fall, all bets are off with regards to how quickly and violently the US Majors could fall.

An -11.5% decline in the NQ represents a -730 pt move from recent highs. A -20% decline, should it happen, would represent a -1260 pt move lower in the NQ.
When the dam breaks, should the Transportation Index continue to rotate lower, the move in the US majors to correlate with the reduced expectation within the US economy could be very dramatic. We have experienced an elated, almost exuberant market rally over the past 5+ months. The Transportation Index peaked in late 2016, then established a series of higher peaks in 2017 with the most recent peak ending on October 13. The projected cycle event was on October 26. The next cycle event in the Transportation Index is April 4, 2018. We have nearly 5 months of market activity to see how this plays out and to see if the Transportation Index continues to push lower.
We suggest all ActiveTradingPartner.com members and readers pay attention to the price and trend of the Transportation Index and realize that any continued lower price activity will create a broader disparity between it and the US Majors. As some point, one of these will break and we believe it will be the US majors rotating lower to create a relief move lower that could potentially turn into a moderately deep market retracement. We believe a minimum of -6% to -10% from current levels would be just the beginning of the move.
If our analysis of the Transportation Index is correct, the Transportation Index will attempt to recover a moderate price rally within the next few weeks and this move will help create broad market support for the US Majors temporarily and that could be the next great opportunity to short the market (buy an inverse ETF) to catch the next big sell off. Time will tell.
If you enjoy this type of analysis and want to see how we are able to assist our members with timely and accurate trading signals, detailed market research, proprietary price modeling systems, live alerts, updates, and more, then visit www.ActiveTradingPartners.com today and see what we offer our clients.
Chris Vermeulen


