
Tariffs on Steel and Aluminum have grabbed the headlines as the U.S. sits down with Canada and Mexico to discuss NAFTA. President Trump has tied NAFTA negotiations to steel and aluminum tariffs which should add uncertainty to the capital markets. Surprisingly the increased uncertainty in riskier assets has not spilled over into gold prices. The increase in the value of the greenback has been one of the factors weighing on gold prices as U.S. yields continue to remain buoyed. A rally in industrial metals could buoy silver.
The daily chart of gold bullion shows that prices will likely test support near an upward sloping trend line that coincides with the February lows near $1,306. The 10-day moving average was unable to make a higher high and shows that the short-term trend is down is in place. A break of support of $1,306 would lead to a test of the November highs at $1,299. Short-term resistance is seen near the 10-day moving average at $1,323 and then medium-term resistance is seen near a downward sloping trend line that comes in near $1,360. Prices are forming a wedge pattern where energy is building as traders await a breakout or a breakdown.
Gold Price Chart
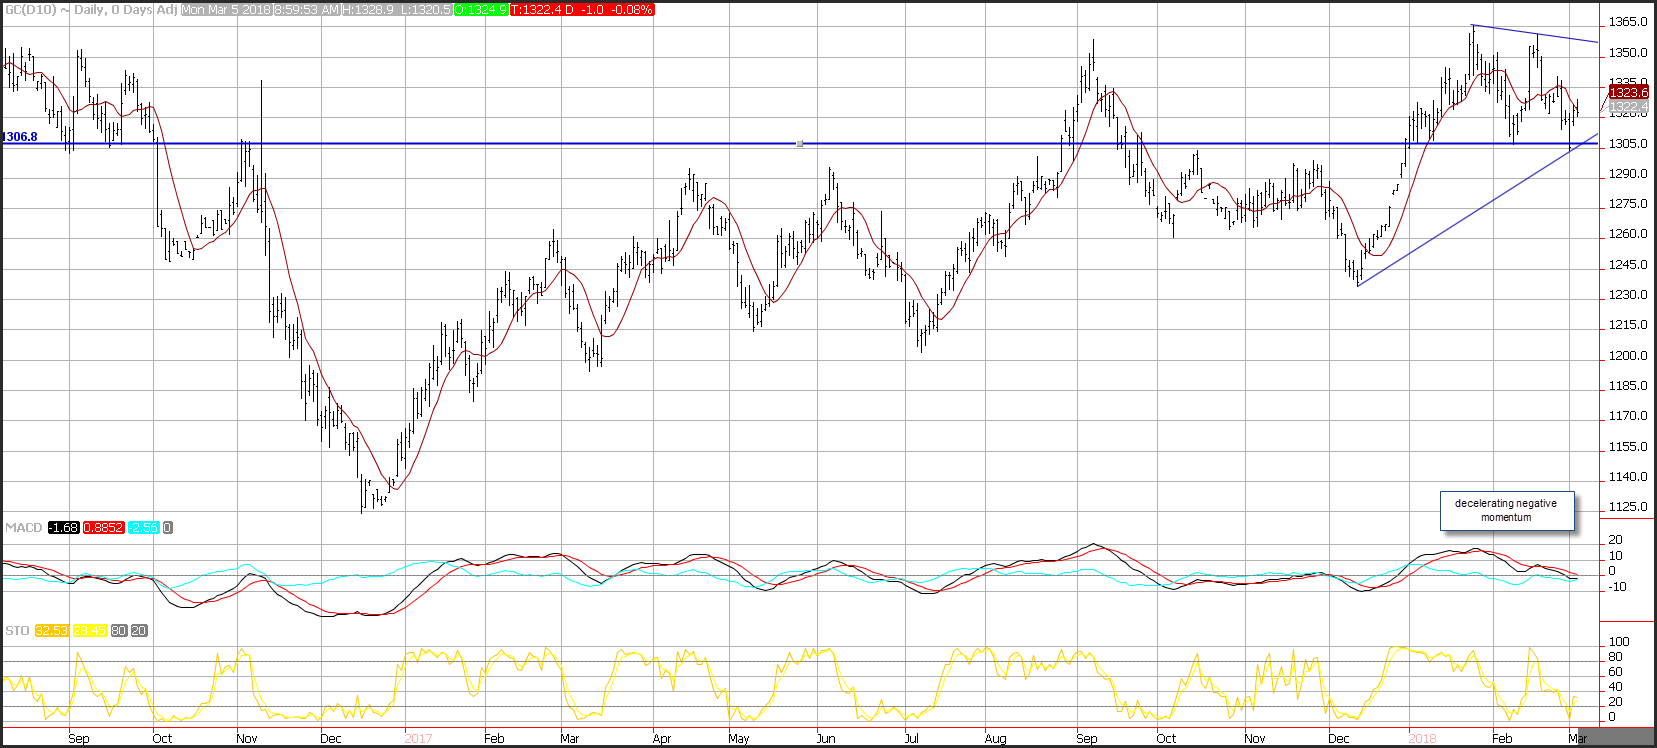
Negative momentum is decelerating. The MACD histogram is printing in the red with an increasing trajectory which reflects consolidation. The fast stochastic has bounced from oversold territory and when this happened in February, December, October and November, prices rebounded in tandem. The current reading of 32 is at the bottom of the neutral range above the oversold trigger level of 20.
Silver Price Chart
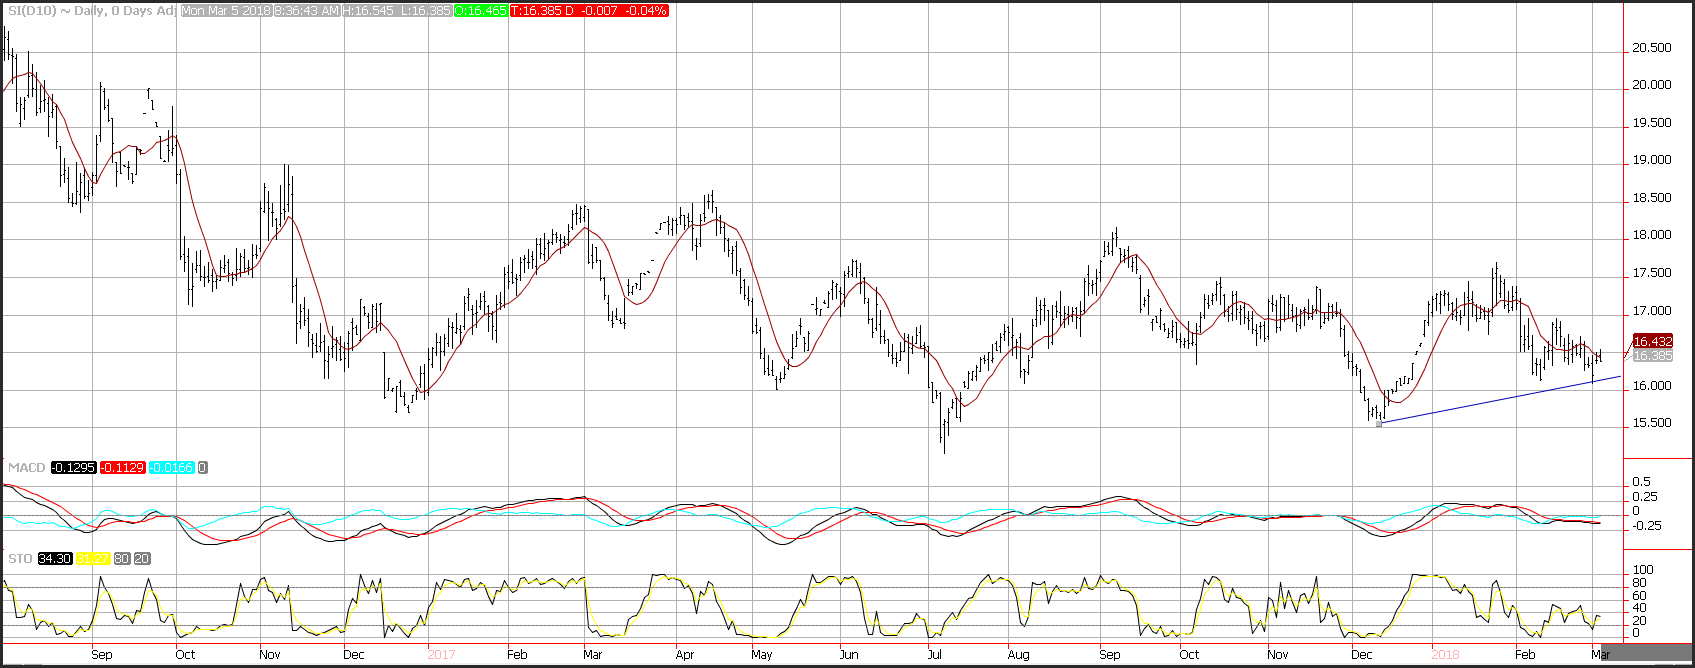
The daily chart of silver bullion shows prices are trading sideways. The choppy nature of the price action reflects market uncertainty. U.S. tariffs on industrial metals such as aluminum could spill over into silver prices, initially pushing silver prices higher. Support is seen near an upward sloping trend line at $16.15. Resistance is seen near the 10-day moving average at $16.43, and then the mid-February highs at $16.99. Momentum is neutral. The MACD histogram is printing near the zero-index level with a flat trajectory which reflects consolidation. The fast stochastic is printing a reading of 34, after dropping into oversold territory last week, which reflects consolidating with an upward bias.
Spread Between Gold and Silver Chart
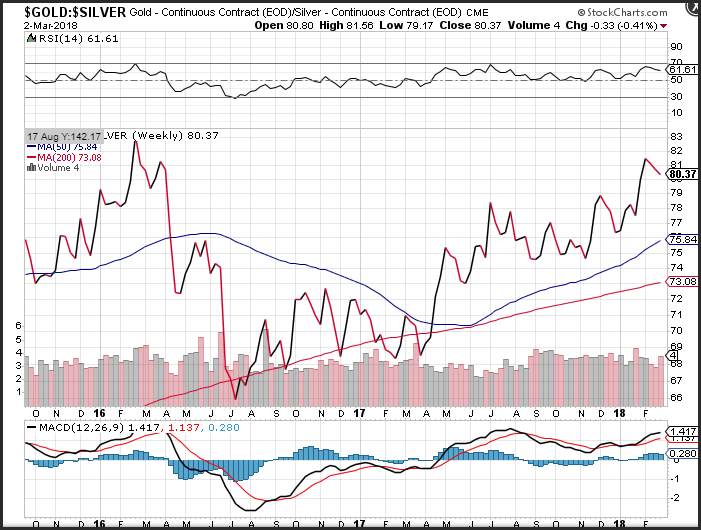
For the third week in a row, silver prices have outperformed gold. After the ratio between gold and silver hit a 23-month high of $81.52, in mid-February silver retraced some of its losses pushing the ratio back to the $80.37 level. The consolidation in the pair has coincided with a consolidation in both gold and silver prices respectively. This spread will likely need to break out if prices are going to continue higher.
Momentum on the ratio on a weekly basis is positive but decelerating, as the MACD (moving average convergence divergence) histogram prints in the black with a flattening trajectory which reflects consolidation. The RSI of the ratio appears to be declining after making a move toward the overbought trigger level of 70 just 4-weeks ago, which also reflects decelerating positive momentum.
If you are looking to take advantage of a time to add precious metals to your portfolio, click on this link to get access to your Investment Kit or better yet, give us a call today at 800–982–6105.
Good Investing,
Treasure Coast Bullion Group
Read more by Treasure Coast Bullion Group, Inc - Staff Writer


