Gold prices slid to the bottom end of its current trading range last week but bounced on its first test of support near 1,305. The dollar gained traction last week, as softer than expected inflation in Euro, allowed U.S. yields to outpace their European counterparts. The data in the U.S. was nothing to write home about. The drop-in retail sales have economists reducing their forecasts of Q1 GDP. Inflation was also tame, which should cap the rise in the U.S. dollar. Traders await the Fed’s monetary policy decision.
The daily chart of gold bullion shows that prices are testing support near the February lows at $1,305. Gold bar prices slipped through trend line support which is now resistance near the 10-day moving average at $1,322. There is additional resistance near the March highs at $1,342 and then a downward sloping trend line at $1,360. A break of support of $1,305 would lead to a test of the November highs at $1,299.
Gold Price Chart
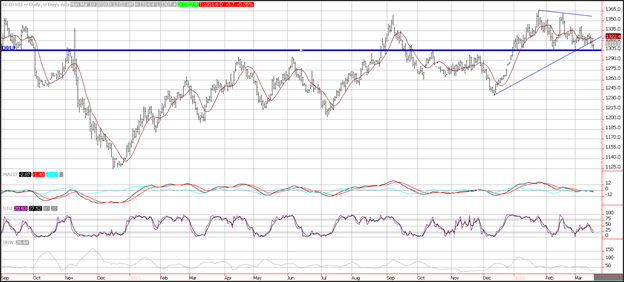
Momentum has turned negative as the MACD (moving average convergence divergence) index generated a crossover sell signal. This occurs as the MACD line (the 12-day moving average minus the 26-day moving average) crosses below the MACD signal line (the 9-day moving average of the MACD line). The MACD histogram is edging negative, and the trajectory is downward sloping which reflects negative momentum. The fast stochastic moved lower and is just above the oversold trigger level of 20. Historical volatility as reflected by the Bollinger band low is near the lows levels seen in the past 2-years and shows that prices are building up energy and could be poised for a breakout or breakdown.
Silver Price Chart
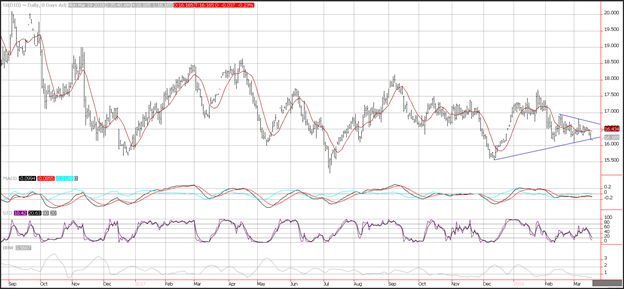
The daily chart of silver bullion shows prices are breaking down through trend line support. The consolidation between mid-October and late November allowed volatility to remain subdued but a close below this level could lead to some long liquidation. Silver bar prices have been rangebound since December of 2016.
Support is seen near the March lows at $16.09. Resistance is seen near the 10-day moving average at $16.43. Momentum is negative. The MACD (moving average convergence divergence) index generated a crossover sell signal. This occurs as the MACD line (the 12-day moving average minus the 26-day moving average) crosses below the MACD signal line (the 9-day moving average of the MACD line). The fast stochastic is oversold. The index is printing a reading of 10, well below the oversold trigger level of 20 which could foreshadow a correction. The Bollinger band width is printing near the lowest levels seen in the past 2-years, reflecting very low historical volatility.
Spread Between Gold and Silver Chart
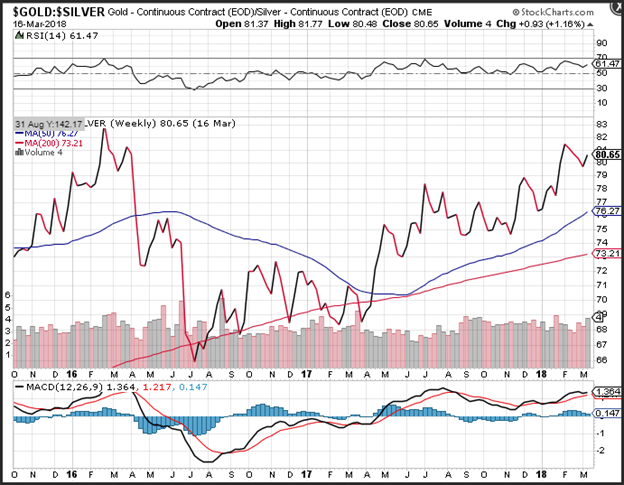
Gold prices outperformed silver in the latest week snapping a 4-week streak where silver outperformed gold. The relative underperformance came as both precious metals moved lower showing that traders are more concerned about the lack of growth than a rising dollar.
Momentum on the ratio on a weekly basis is positive but decelerating, as the MACD (moving average convergence divergence) histogram prints in the black with a flattening trajectory which reflects consolidation. The RSI of the ratio edged higher which reflects accelerating positive momentum.
If you are looking to take advantage of a time to add precious metals to your portfolio, click on this link to get access to your Investment Kit or better yet, give us a call today at 800–982–6105.
Want to read more articles like this? Sign up for our free e-newsletter, and you'll learn when new articles have been published. To see a list of recent articles visit our Treasure Coast Market News page.
Good Investing,
Treasure Coast Bullion Group
Read more by Treasure Coast Bullion Group, Inc - Staff Writer