Last week marked the 9th anniversary of the collapse of Lehman Brothers. It was one of the biggest milestones of the Global Financial Crisis (“GFC”) that began approximately a year earlier in 2007. Corporate earnings were abnormally weak during the GFC. I bring that up because a much cited stock market valuation metric that has been prescient gauging past bubbles could be overstated due to those abnormally weak earnings. Those of you concerned about the valuation of the U.S. stock market should read on.
What Does Average Mean?
The cyclically-adjusted price-to-earnings (“CAPE”) ratio is normally credited to Nobel-prize winning economist Robert J. Shiller. It adjusts for the ups and downs of business cycles by comparing the price of the S&P Composite Index to the average, annual inflation-adjusted earnings of that index over the previous 10 years. There are three types of averages: mean, median and mode. The type of average the CAPE ratio uses is the mean (a.k.a. arithmetic mean). Though the CAPE ratio has been shown to be a reliable predictor of future long-term stock market returns, it has also been widely criticized.
One criticism is that the CAPE ratio is susceptible to outliers. For example, those abnormally weak earnings that occurred during the GFC drag the mean, annual inflation-adjusted earnings down. This could make the CAPE ratio of the S&P Composite Index look more expensive than it may actually be. It has been widely reported that the CAPE ratio is currently at a very high level behind only two other stock market peaks: 1) the Tech Bubble, and 2) the stock market bubble that occurred during the Roaring Twenties (immediately preceding the Great Depression). In both cases, the stock market eventually crashed and in spectacular fashion.
One way to adjust for this problem of abnormally weak earnings is to instead use the peak earnings of the past decade. This approach has been credited to investment manager John Hussman. Ironically, the lesser known Hussman P/E currently shows that the S&P Composite Index is at a very expensive level second to only the Tech Bubble. Those who argue the U.S. stock market is not expensive don’t care for this approach.
Using a Better Average
I agree that using an arithmetic mean makes the CAPE susceptible to outliers. I also agree the CAPE ratio can also make the valuation of the S&P Composite (or any stock market index) look more expensive than it may actually be. Though I believe the Hussman P/E is useful, I don’t believe it is a substitute to the CAPE ratio. An average measures a central or typical value. Using a peak figure, as in the case of the Hussman P/E, does not do this. By using peak earnings, the Hussman P/E is in fact driven by outliers.
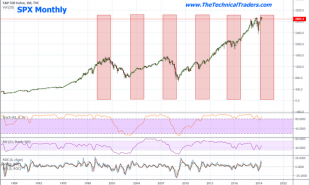
Mentioned earlier, there are three types of averages. A better type of average would be the median. It literally represents the middle of a sequence of ranked numbers. In most cases, it is not influenced by outliers. By using median (instead of mean) earnings, I refer to this valuation approach as the CAPME ratio. It currently shows the S&P Composite is not the second or third most expensive stock market cycle. This finding supports those who criticize the traditional CAPE ratio of overstating the valuation of the S&P Composite Index. The problem for critics though is using the CAPME ratio still shows the U.S. stock market is very expensive right now. In fact, it is the fourth most expensive, behind the stock market cycle that occurred during the Subprime Mortgage Bubble. Based on the data Professor Shiller uses, you can see this in the graph below that looks back 135 years.

Valuations in Perspective
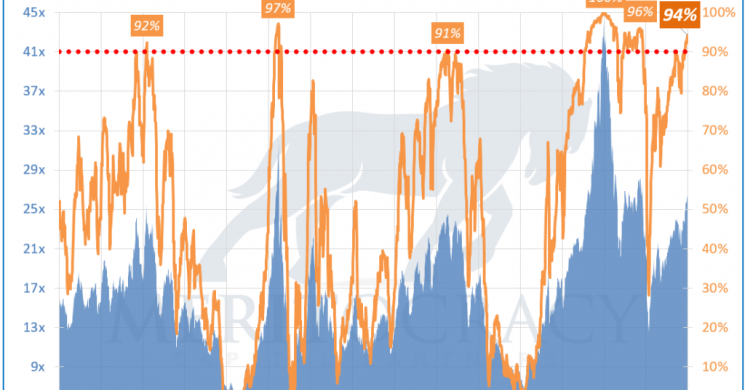
You will notice in the graph above that the past 5 stock market bubbles were all valued at one point at more than 20-times median, annual, inflation-adjusted earnings. The valuation range of those peaks is wide though given the Tech Bubble was valued at more than 40-times at its peak. This makes the Tech Bubble potentially an outlier. Furthermore, all 5 stock market bubbles did not last long. They were fleeting. To put this all into perspective, consider these valuations by their percentile ranks. You can see this from the orange lines in the graph below.

The graph above shows the aforementioned 5 stock market cycles turned into bubbles when their CAPME valuation ratios reached a very high level of roughly the 90th percentile (red dotted line). In other words, these bubbles formed when their valuations were near or at the most expensive decile. Investors beware: the valuation of the S&P Composite Index is currently ranked at the 94th percentile. This puts the U.S. stock market smack-dab at the heart of bubble territory.
It has been argued lots that the high stock market valuation is justified by low interest rates. This argument does not work for me. Let me tell you why. Yields on 10-year U.S. treasury bonds in early-1941 were lower than they are now. Despite lower interest rates in early-1941, the stock market CAPME valuation ratio was quite low at that time ranking at around the 30th percentile. Furthermore, the amount of debt provided by stock brokers used to fuel the current stock market cycle is at a record level. This could prove problematic given bubbles driven by financial leverage are particularly dangerous.
Summary
The aforementioned 5 stock market cycles turned into bubbles when their CAPME valuation ratios reached the 90th percentile. The U.S. stock market is back there again. Its valuation is squarely in the middle of that very expensive decile looking back 135 years. The 5 previous instances of stock market bubbles suggest this will not end well. Bubbles never do, particularly ones driven by financial leverage.
Whether or not you believe stock market bubbles occur when their valuations are near or at the most expensive decile, please consult an investment fiduciary before making any investment decisions. Should you be in search of an investment fiduciary, then Meritocracy Capital Partners Inc. would welcome the opportunity to serve as your partner.
Meritocracy Capital Partners Inc. is a boutique investment management firm & portfolio manager that aligns itself with its clients. We build trust & accountability by providing a fee structure driven by performance and by having our money invested right alongside our clients’ money. As a result, we treat our clients’ money like our very own.
Read more by MarketSlant Editor