Stocks extended their short-term run-up on Wednesday, as investors’ sentiment further improved following Tuesday’s rally. The S&P 500 index got closer to its late May local highs. Is this a new uptrend or just an upward correction?
S&P 500 - 100 Points Above Monday’s Low, Will Rally Continue?
The U.S. stock market indexes gained 0.8% on Wednesday, extending their Tuesday’s run-up, as investors’ sentiment further improved despite the ongoing trade war fears. The S&P 500 index traded almost 100 points above its Monday’s local low yesterday. It is currently 4.3% below its May the 1st record high of 2,954.13. Both the Dow Jones Industrial Average and the Nasdaq Composite gained 0.8% on Wednesday.
The nearest important resistance level of the S&P 500 index is now at 2,830-2,840, marked by the late May consolidation. The resistance level is also at 2,850-2,860. On the other hand, the nearest important support level is at 2,800. The support level is also at 2,770-2,780.
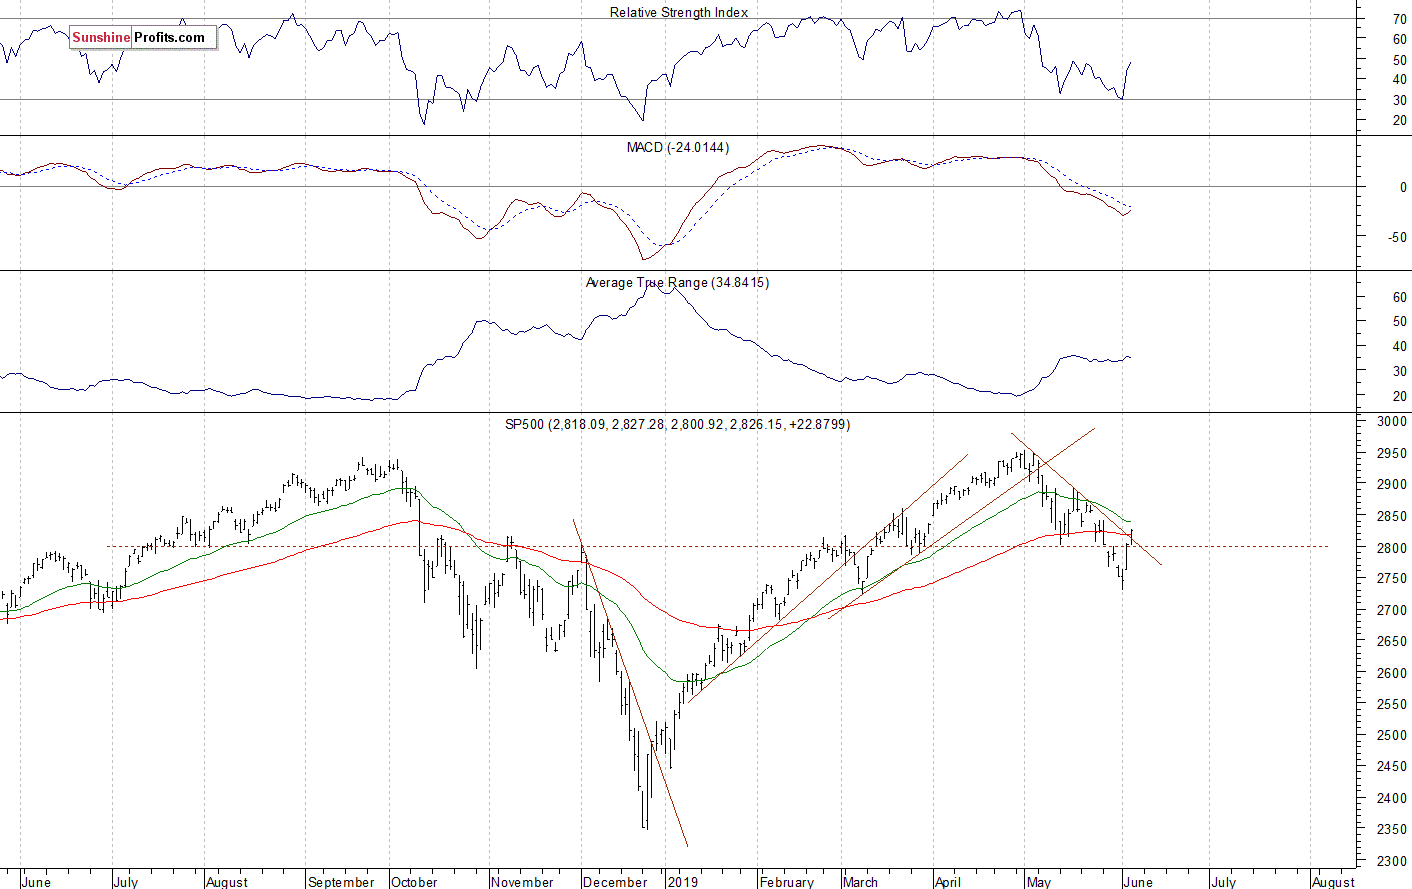
The broad stock market broke above the last year’s high in the early May. But then the S&P 500 index retraced all of the April’s advance. The market also broke below its two-month-long upward trend in the early May. And now it is trading slightly above the month-long downward trend line:
 Closer to Late May Highs
Expectations before the opening of today's trading session are positive, because the index futures contracts trade 0.3-0.4% above their Wednesday’s closing prices. The European stock market indexes have gained 0.6-0.7% so far. Investors will wait for some economic data announcements today: Unemployment Claims, Trade Balance, Nonfarm Productivity at 8:30 a.m.
The broad stock market will likely extend its short-term uptrend this morning. The S&P 500 may get back to its late May consolidation. If it breaks higher, we could see more buying pressure,
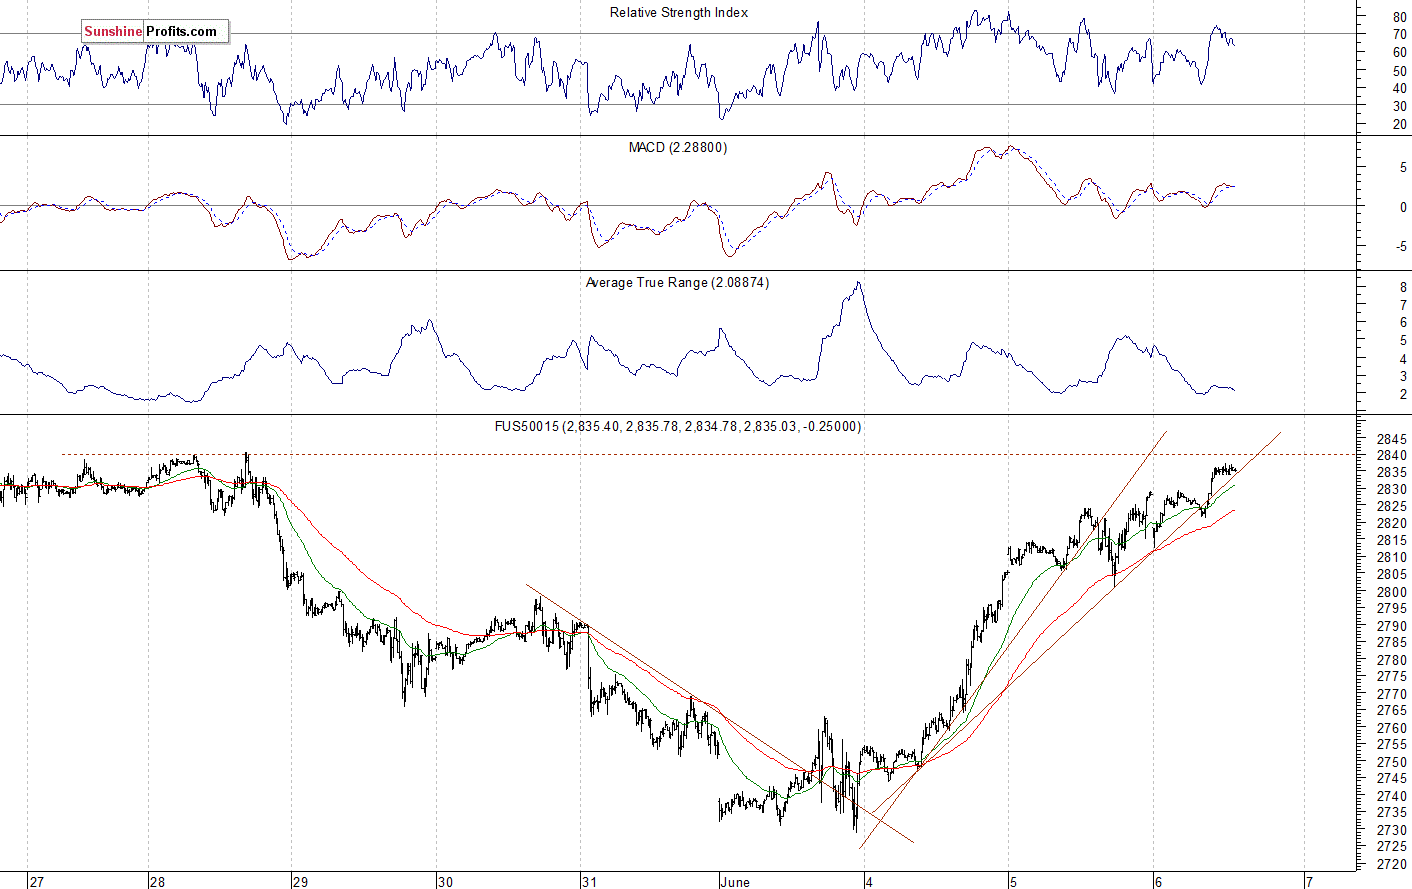
The S&P 500 futures contract trades within an intraday consolidation following an overnight advance. The nearest important resistance level is now at around 2,840, marked by the previous local highs. On the other hand, the support level is at 2,820. The futures contract is at its previous local highs, as the 15-minute chart shows:
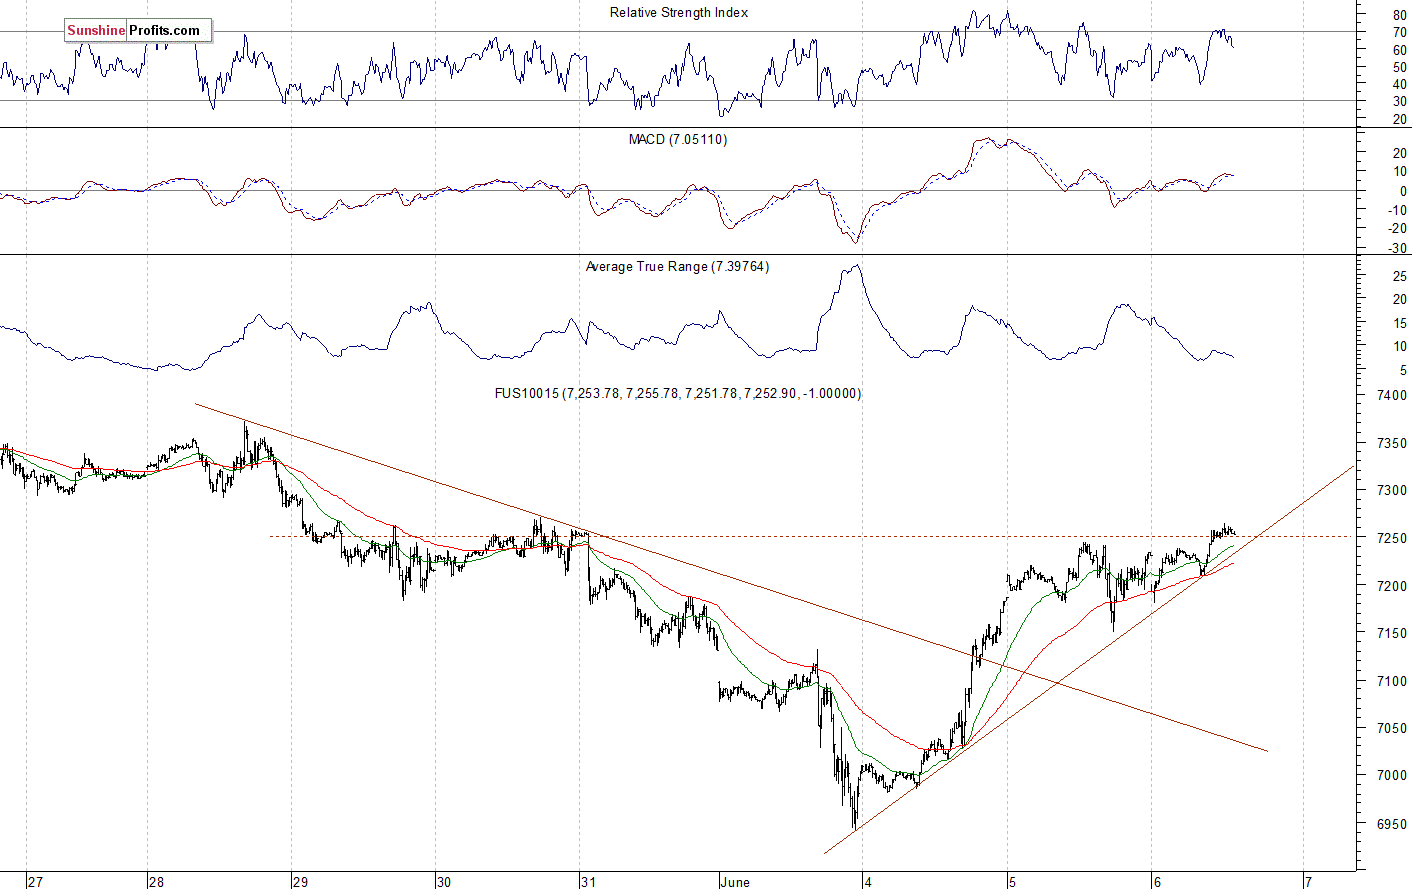
Nasdaq at New Local High The technology Nasdaq 100 futures contract follows a similar path, as it trades at a new local high following an overnight advance. The nearest important resistance level is at 7,250-7,300. On the other hand, the support level is at 7,150-7,200. The Nasdaq futures contract remains slightly above the short-term upward trend line this morning, as we can see on the 15-minute chart:
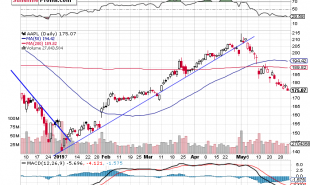
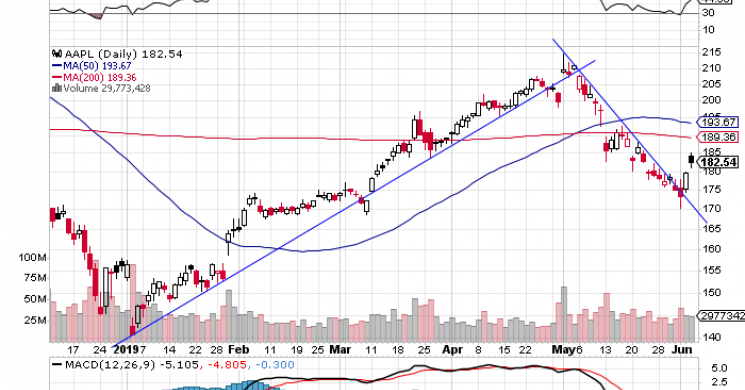
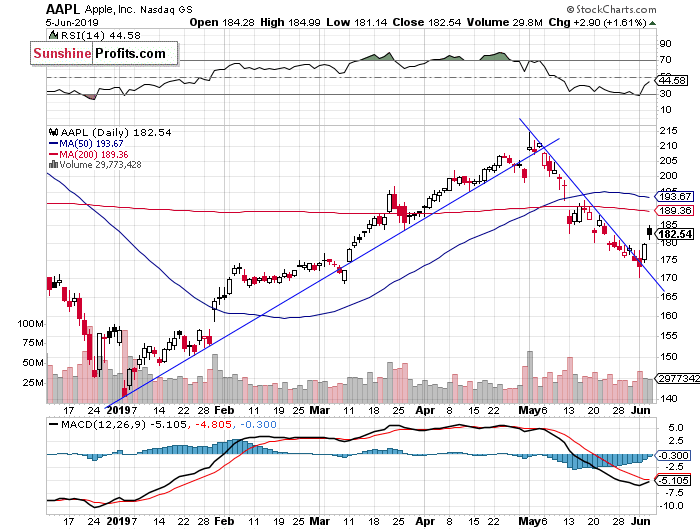
Big Cap Tech Stocks Continued Higher Let's take a look at the Apple, Inc. stock (AAPL) daily chart (chart courtesy of http://stockcharts.com). The stock extended its rally on May the 1st following the quarterly earnings release. Then the price reversed the upward course and broke below the medium-term upward trend line. Since then it was trading within a downtrend. And on Tuesday the stock broke above the downward trend line:
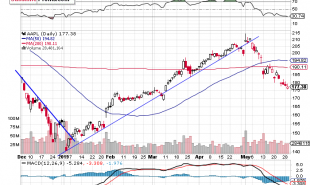
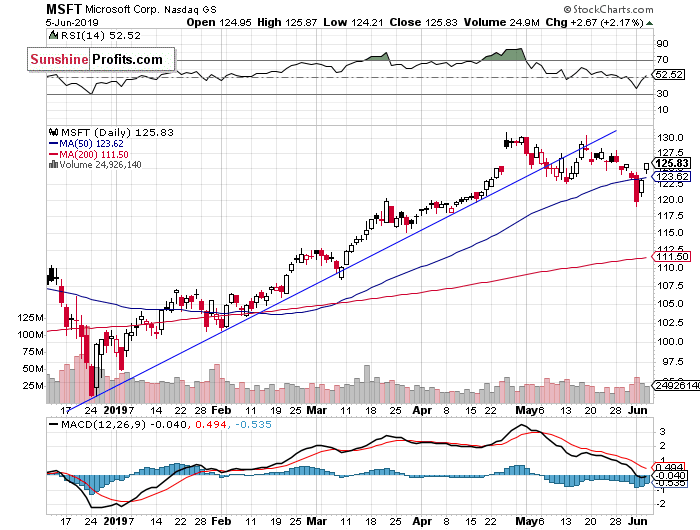
Now let's take a look at the daily chart of Microsoft Corp. (MSFT). The stock accelerated its uptrend in late April, as it reached the new record high of $131.37. Since then, the market was trading within a consolidation. On Monday it broke below the support level, and then it got back higher. So the market extends its consolidation:
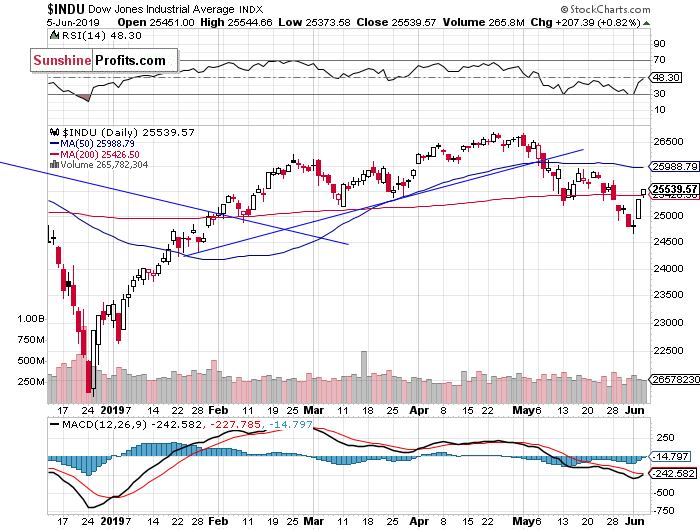
Dow Jones Also Higher The Dow Jones Industrial Average has been relatively weaker than the broad stock market since February. The resistance level remained at around 26,800-27,000, marked by the last year’s topping pattern and the record high of 26,951.8. Last week the blue-chip stocks’ gauge followed the broad stock market, as it accelerated the downtrend. The market broke below its important 200-day moving average. On Tuesday it came back above the 25,000 mark, and on Wednesday it got back above the 200-day moving average:
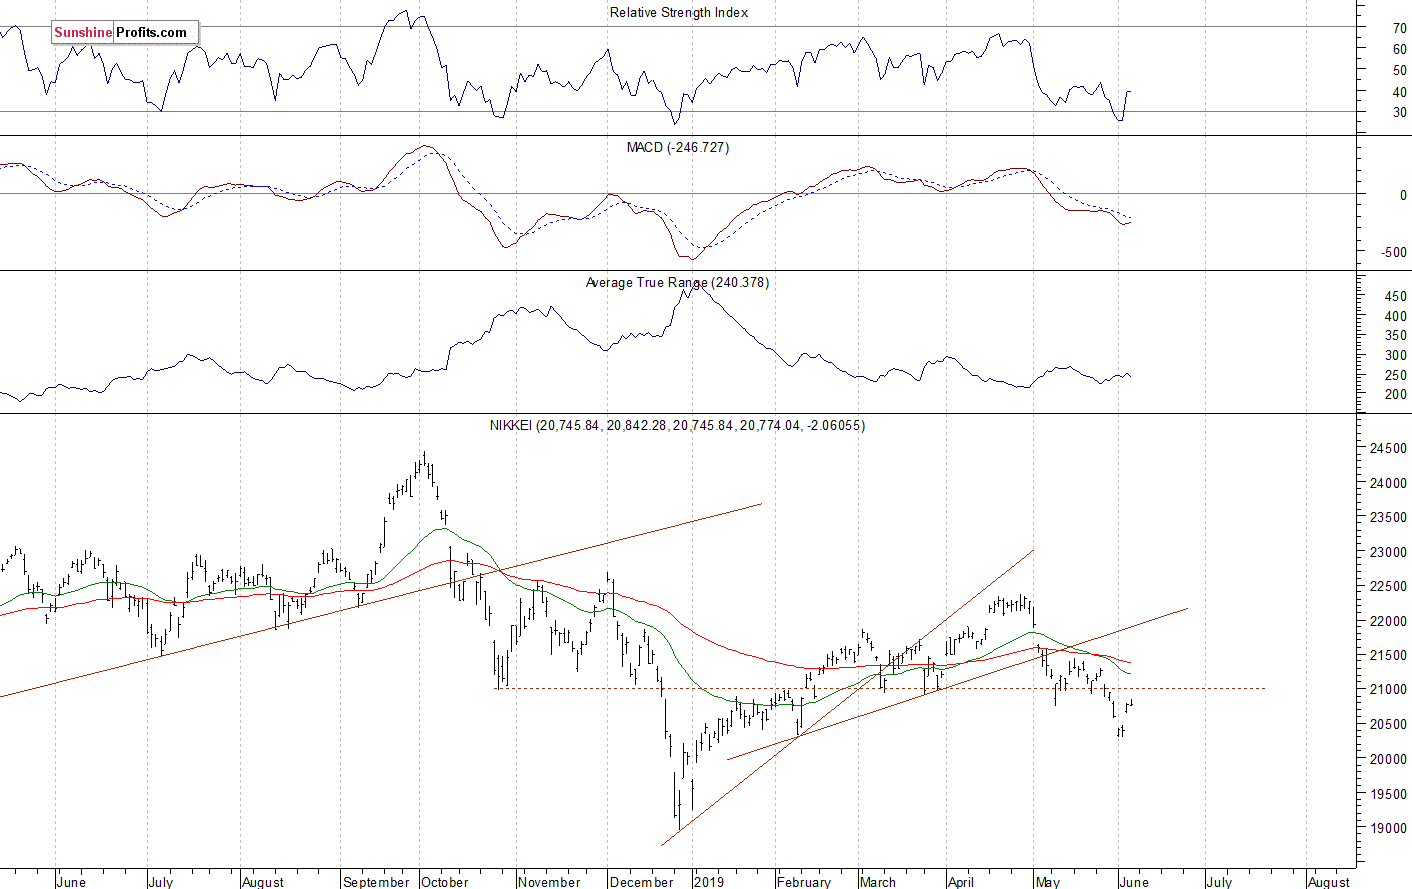
Nikkei Closer to 21,000 Again Let's take a look at the Japanese Nikkei 225 index. It accelerated the last week, as it fell to the early February low of around 20,300. The market extended its month-long correction. This week it retraced some of the sell-off. The resistance level remains at the 21,000 mark.
The S&P 500 index accelerated its short-term downtrend on Monday, as it fell to the local low of around 2,729. On Tuesday it came back higher and it closed above the 2,800 mark, and yesterday the short-term uptrend continued. So was it an important upward reversal or just an upward correction? The market broke slightly above the month-long downward trend line.
Concluding, the S&P 500 index will likely open higher today. The market may retrace more of its recent sell-off. However, we could see a short-term profit taking action at some point.
Thank you.
Paul Rejczak Stock Trading Strategist Sunshine Profits - Effective Investments through Diligence and Care
Read more by MarketSlant Editor