There is a whole lot going on across thet markets after todays trade! And a lot of opportunity developing in the charts. So lets not waste time chatting, And get right into it!
UPCOMING RISK EVENTS:
USD: Revised UoM Consumer Sentiment. EUR: German Retail Sales m/m. GBP: BOE Gov Carney Speaks, Construction PMI, Prime Minister May Speaks. JPY: n/a.
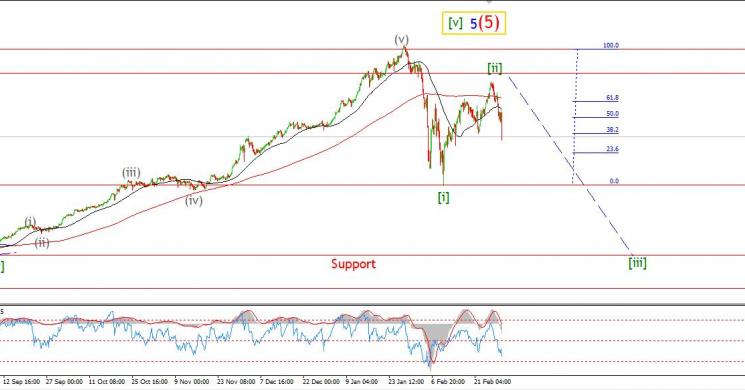
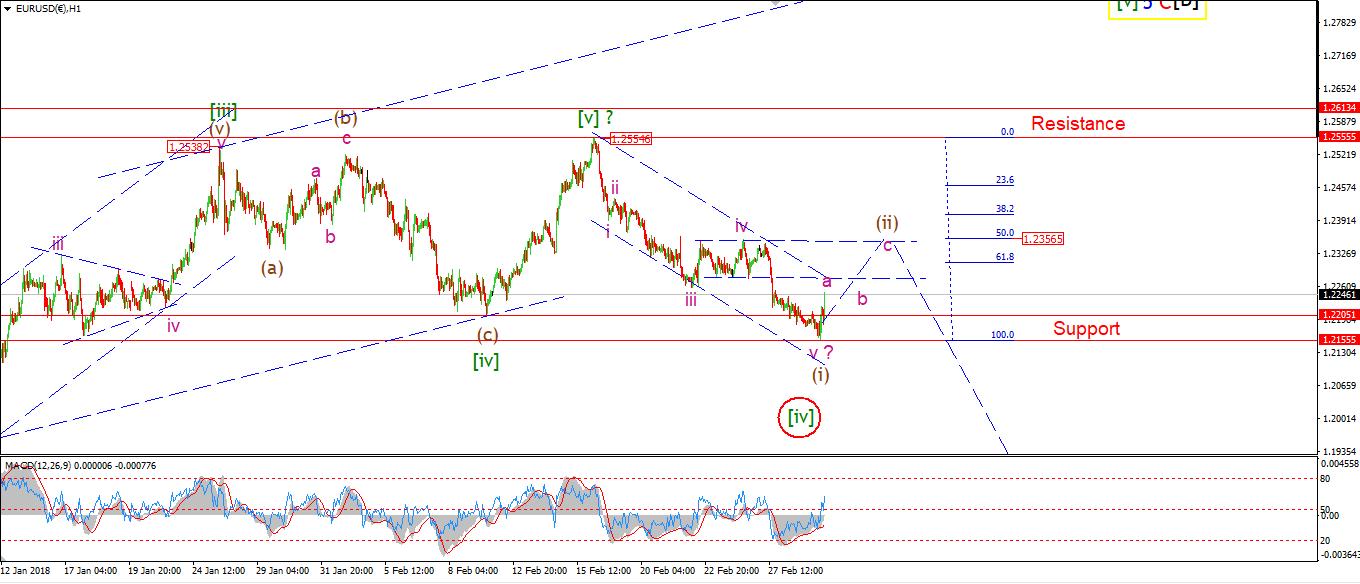
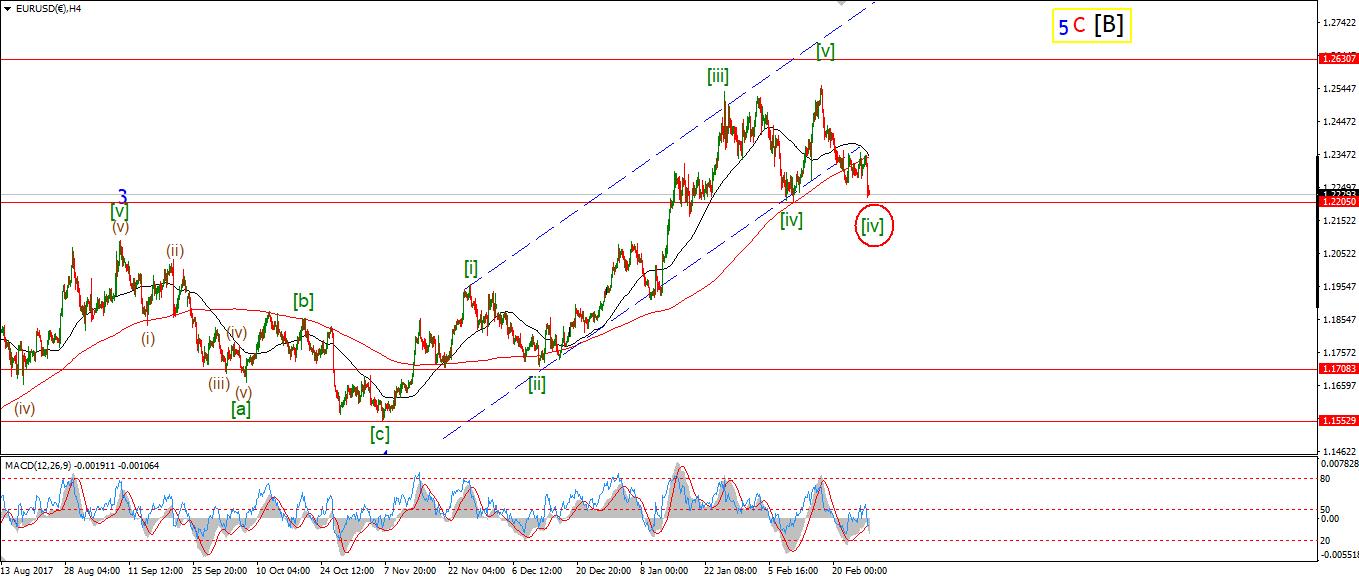
EURUSD
30 min
4 Hours
Daily
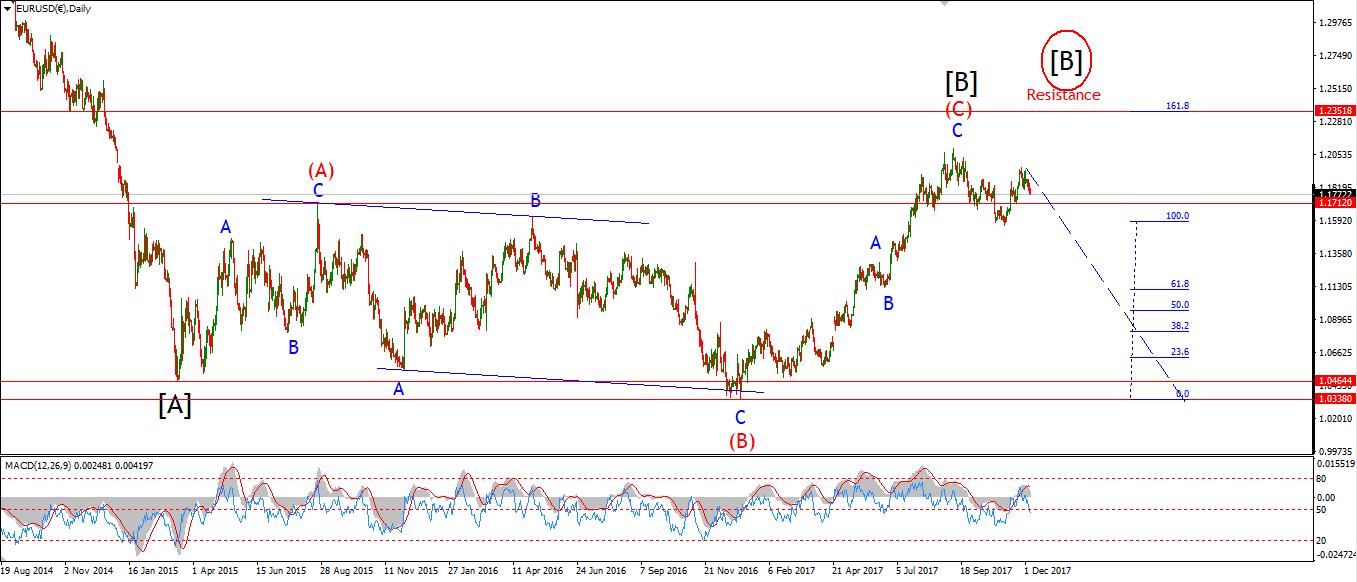
My Bias: long term bearish Wave Structure: Topping in wave [B] black. Long term wave count: lower in wave [C] black.
EURUSD reached into the support band below 1.2205 today. The price seems to have found a bid in that range as we can see a pop higher off the lows.
Wave 'a' of (ii) brown may now be underway and should trace out three waves.
The 50% retracement level lies at 1.2356, So this is the initial target for wave (ii) 1.2155 must now hold.
Tomorrow; It is now time to look for a complete bearish Elliot wave signal off the high in wave (ii) brown. Once wave (ii) is complete, The price structure should off a low risk opportunity on the short side.
GBPUSD
30 min
4 Hours
Daily
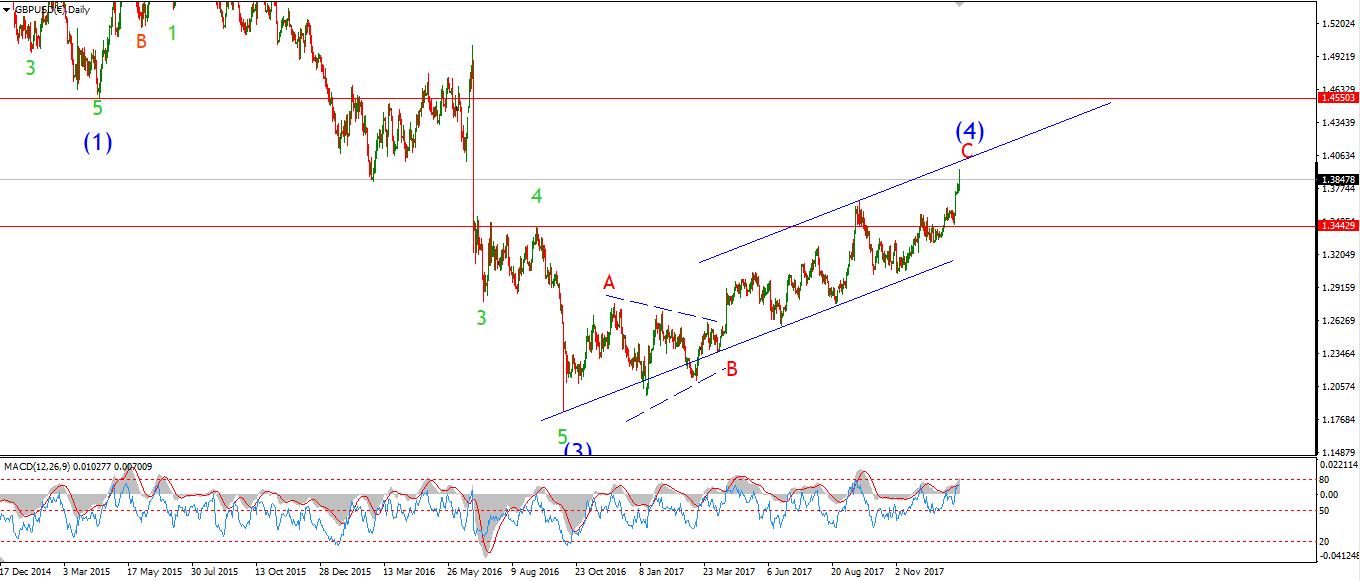
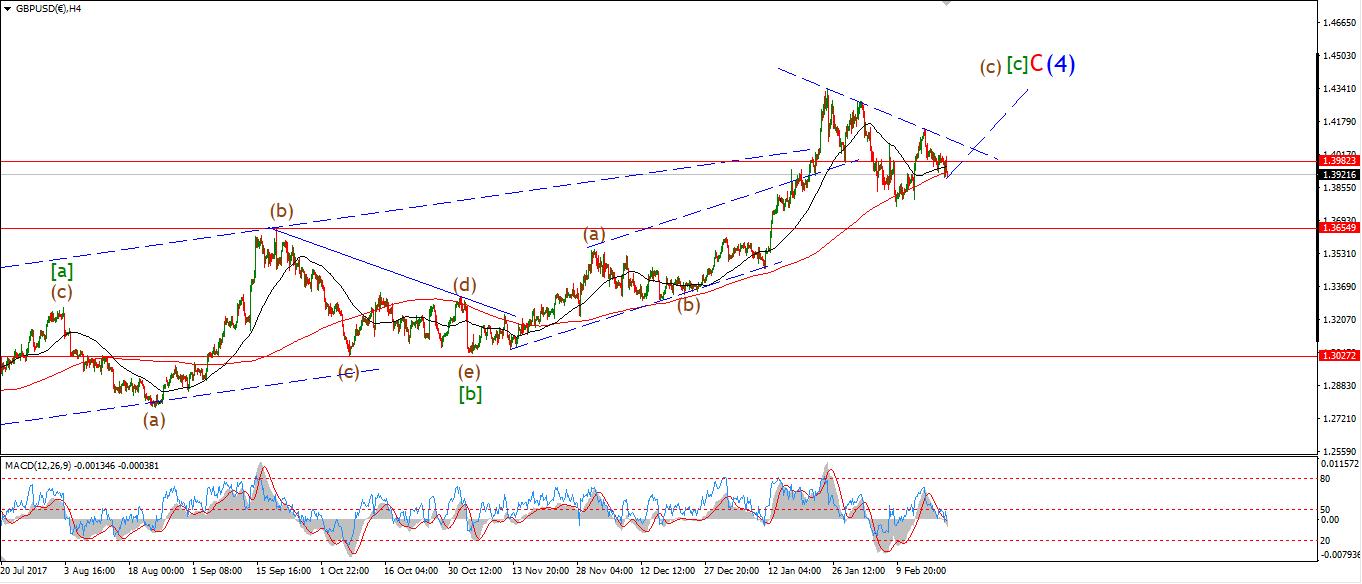
My Bias: short below parity in wave (5). Wave Structure: completing wave (4) blue correction higher. Long term wave count: decline in wave (5) blue, below parity
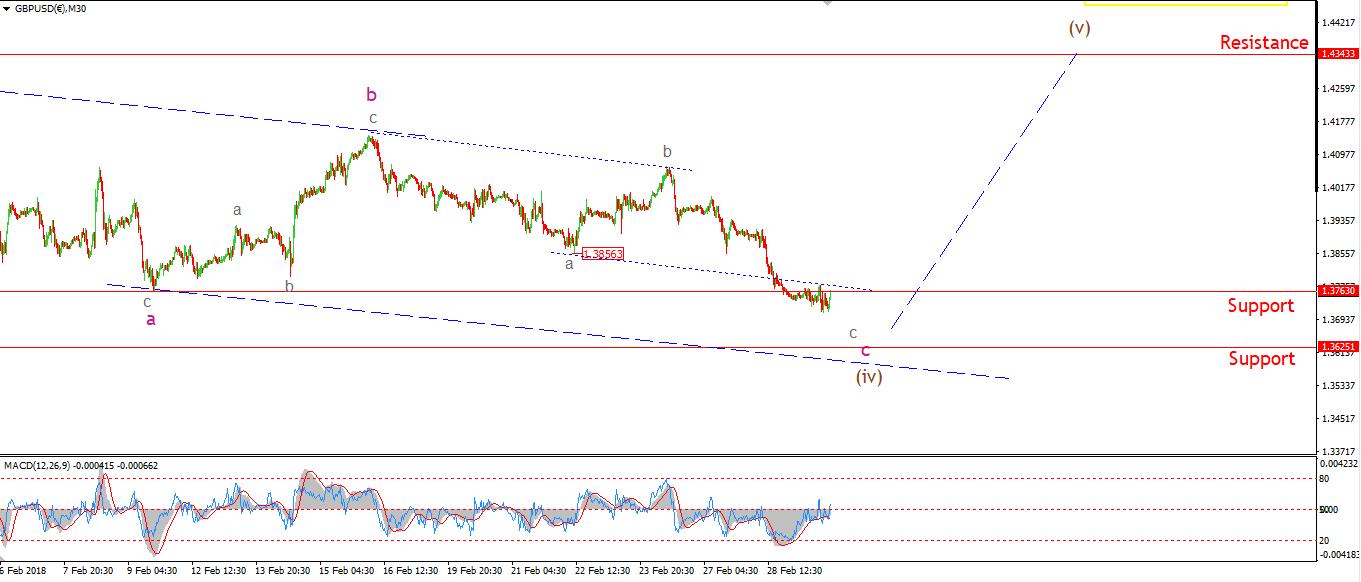
Cable broke support at 1.3763 which is the low of the previous wave 'a' pink. This is the minimum expectation for wave 'c' of the larger double combination wave (iv) brown. The price has already filled the smaller trend channel And completed a three wave structure in wave 'c' pink.
Further support lies at 1.3625, So I expect a bottom to form within this band.
Tomorrow; Watch for signs of a turn higher in wave (v) brown. A break above 1.3856 will signal that wave (v) has begun.
USDJPY
30 min
4 Hours
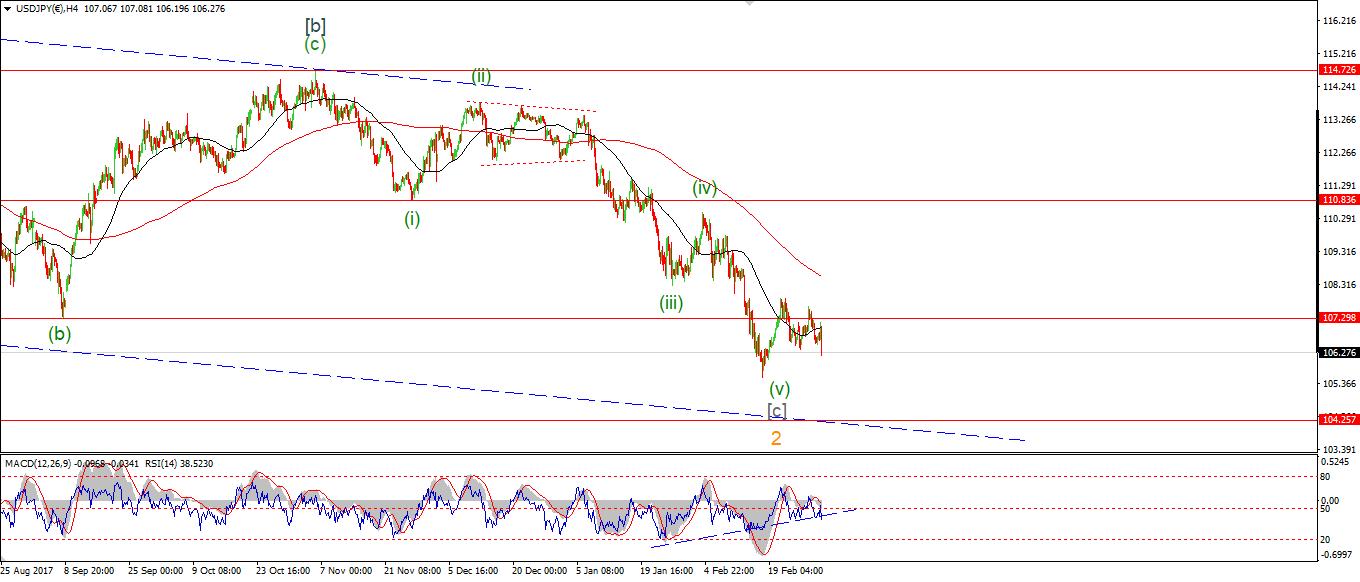
Daily
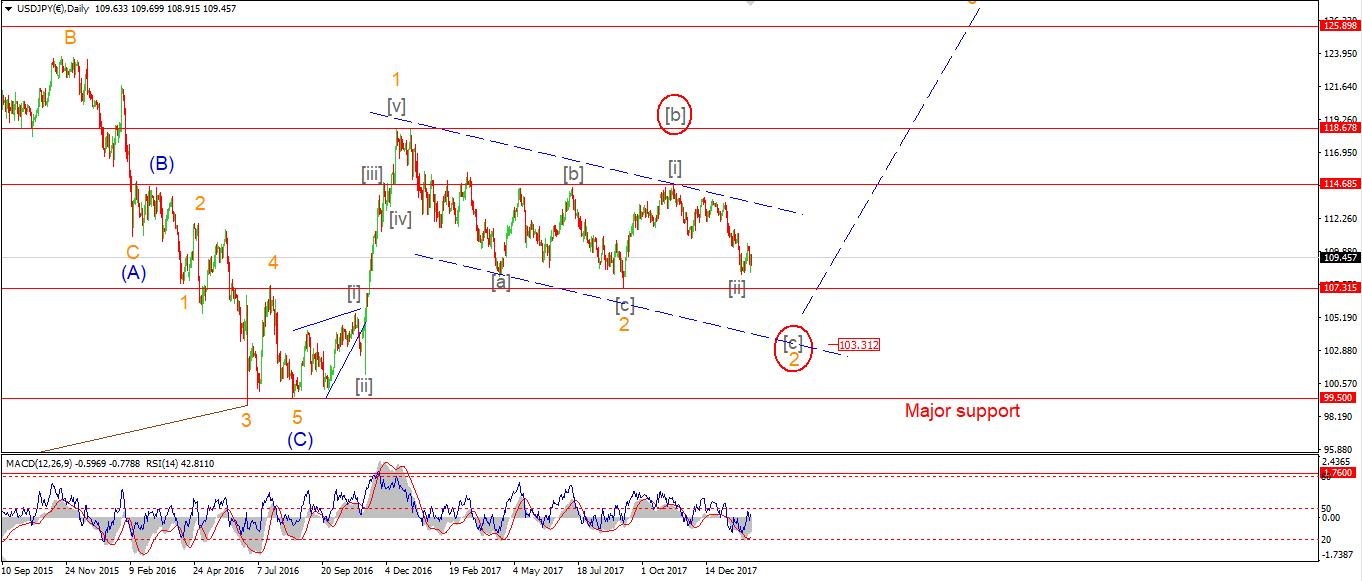
My Bias: LONG Wave Structure: rally in wave [C] Long term wave count: wave [C] is underway, upside to above 136.00
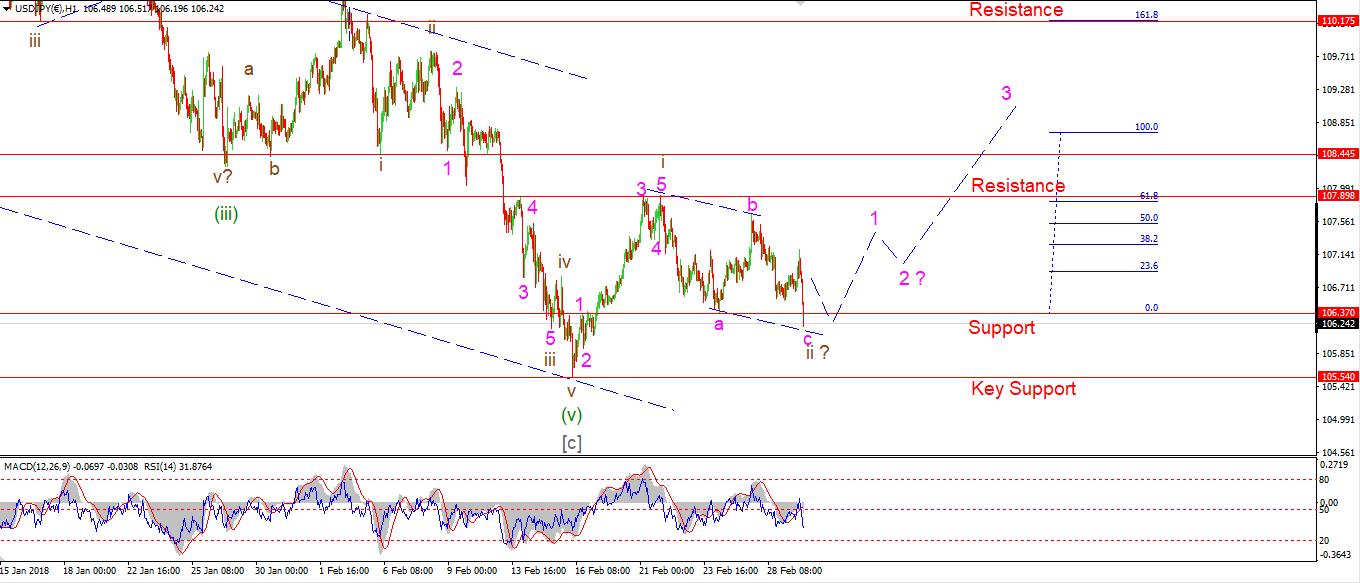
USDJPY has taken a sharp turn down in the last hour, This decline suggests a three wave decline is underway in wave 'c' of 'ii'. A break of 106.37 is the minimum target for wave 'ii' brown. And that has just been reached.
From a technical viewpoint on the 4hr chart, USDJPY is looking pretty bullish with a large bullish divergence in momentum And a 50MA which is turning higher. A bullish MA cross in the 4hr chart will trigger a momentum trade, So that is worth watching.
Tomorrow; I am looking for wave 'ii' to complete at a nearby low and wave 'iii' to begin. Tomorrow could bring a significant low in USDJPY for the long-term.
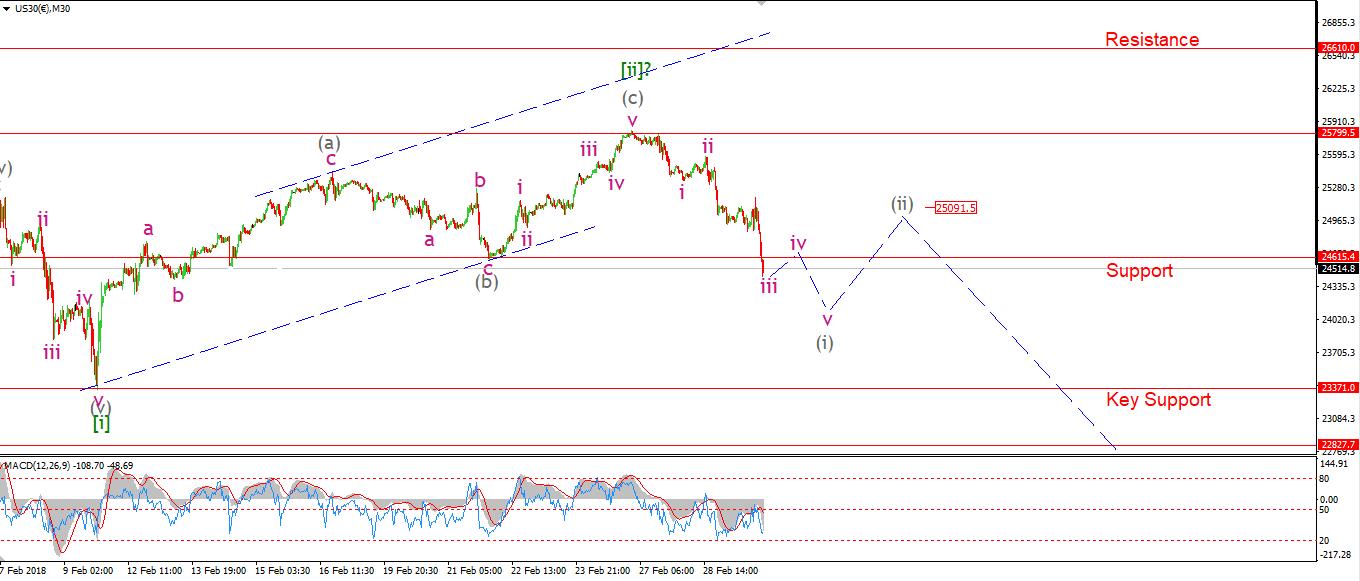
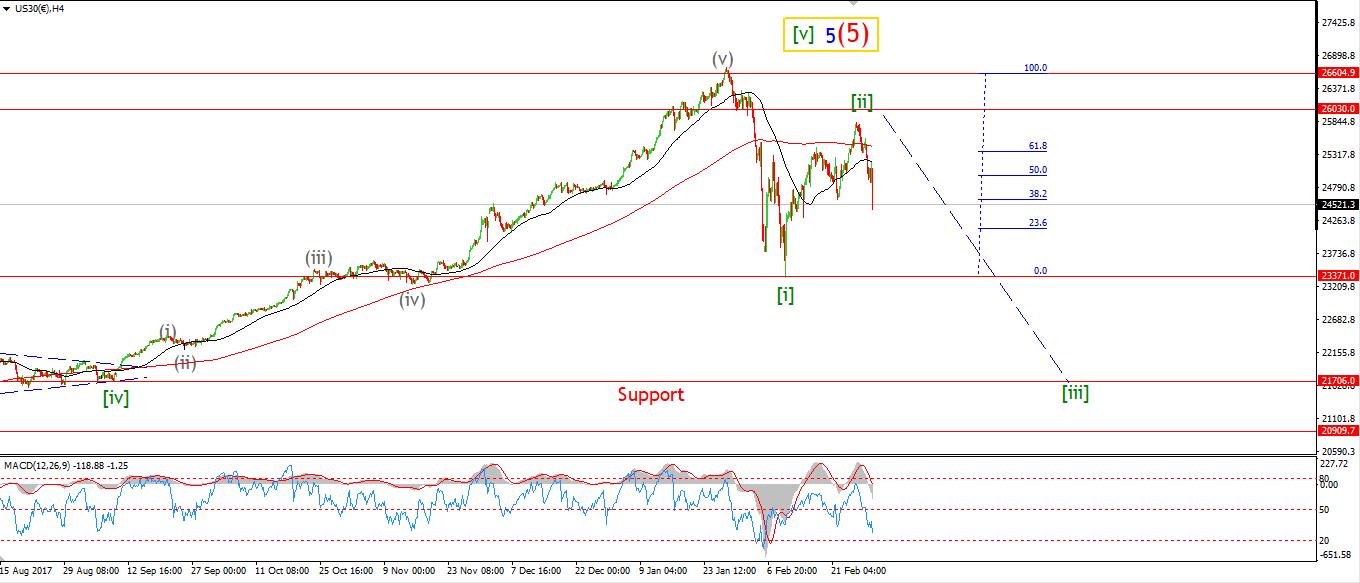
DOW JONES INDUSTRIALS
30 min
4 Hours
Daily
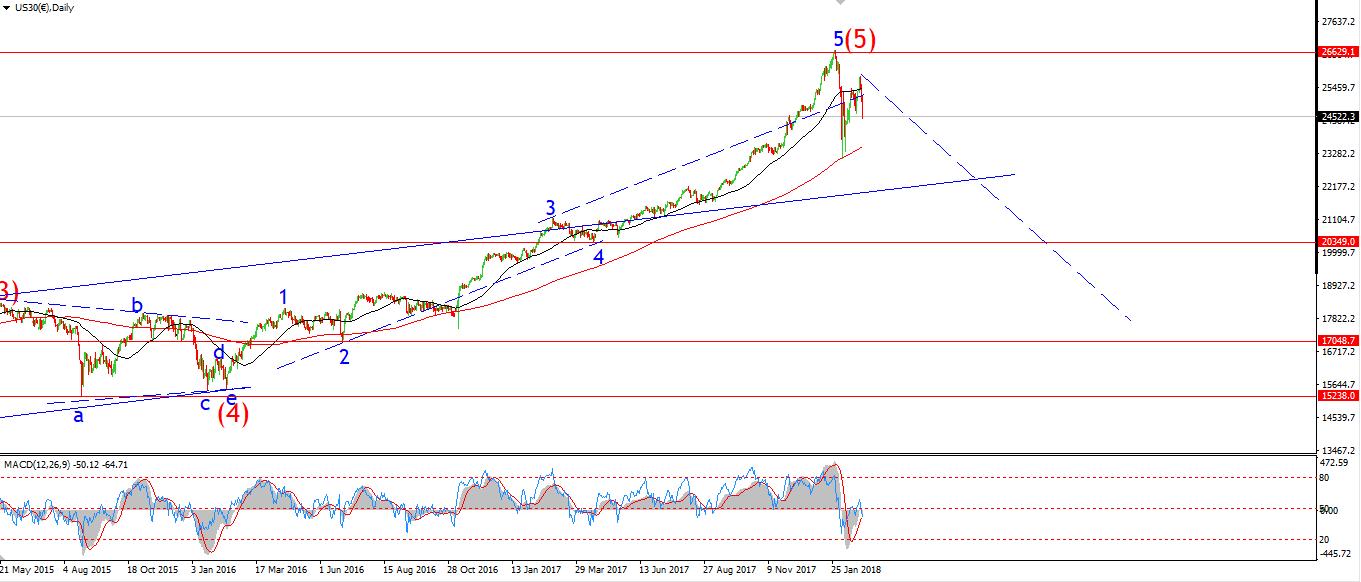
My Bias: market topping process completing Wave Structure: Impulsive 5 wave structure, topping in an all time high. Long term wave count: topped in wave (5)
The DOW broke down through support at the previous wave 'b' this evening. This action triggers the alternate wave count, Which views the recent high as the top in wave [ii] green.
The possibility of another significant decline in stocks is now on the cards!
I have labeled an ongoing 5 wave pattern to the downside in wave (i) of [iii]. Wave (ii) should challenge 25000 again in a three wave rally.
This pattern will also complete a lower degree head and shoulders around wave [ii] green Another sign that stocks are lurching towards another bear market phase.
Tomorrow; Lets take it one step at a time, Watch for wave (i) grey to complete below support, A corrective rally should occur in wave (ii) grey, That will complete a bearish Elliott wave signal off wave [ii]. And a high probability for a larger decline in wave (iii) of [iii]. Exciting time ahead in stocks!
GOLD
30 min
4 Hours
Daily
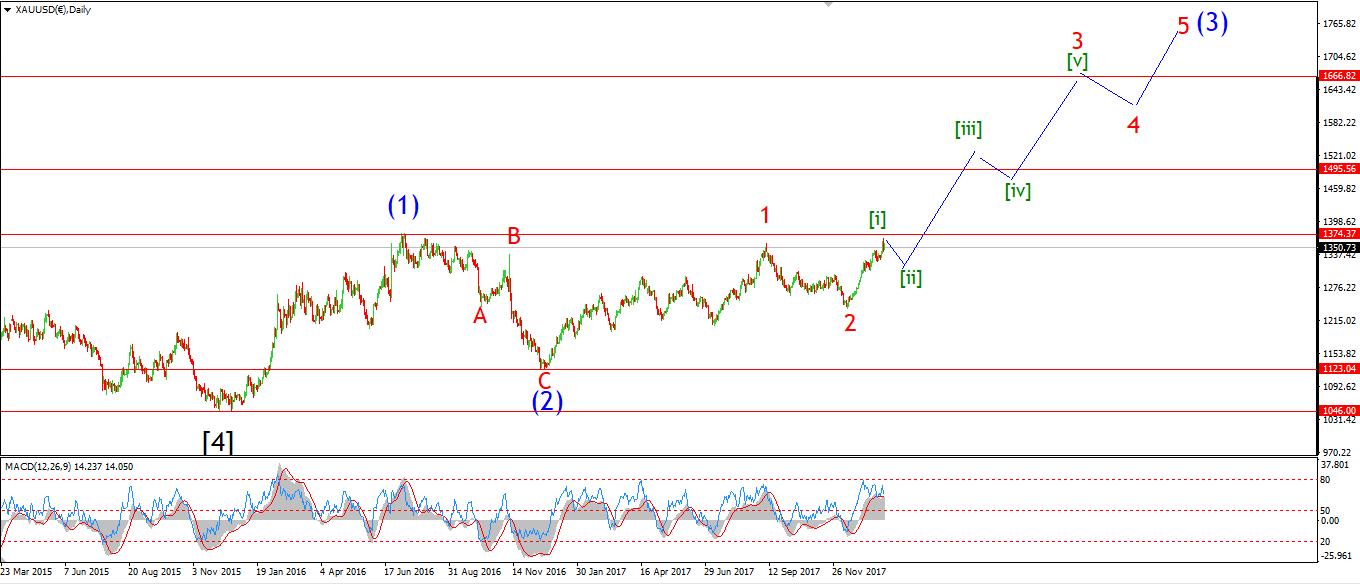
My Bias: Long to a new all time high above 1827. Wave Structure: Impulse structure to a new high. Long term wave count: wave (3) above 1666.
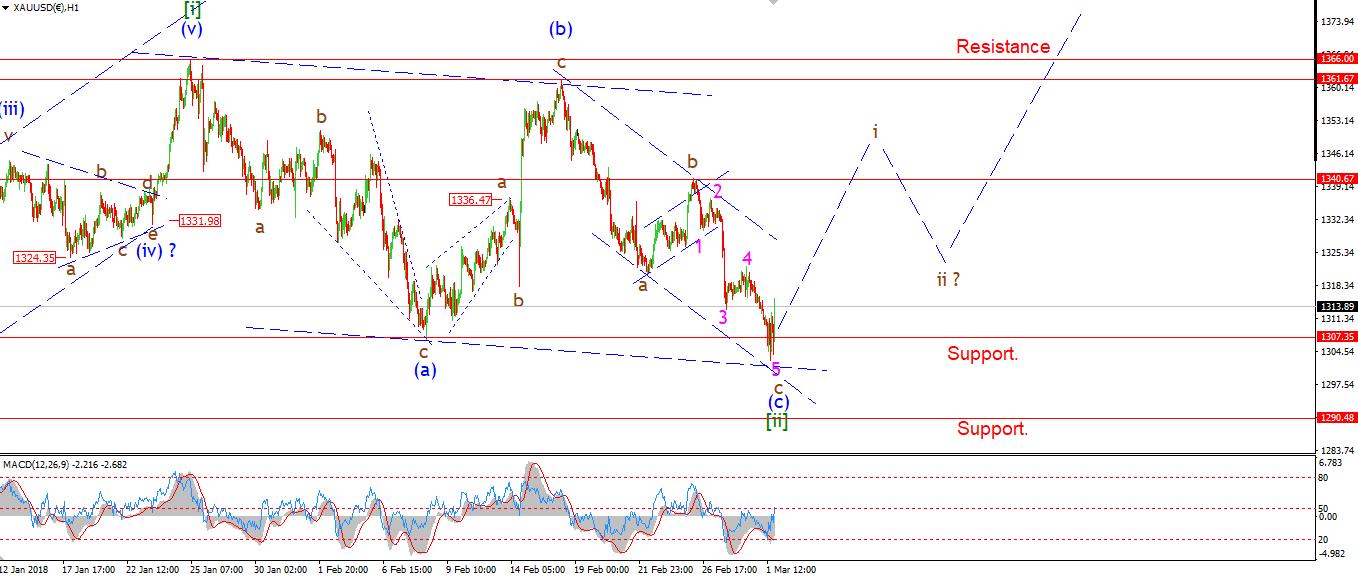
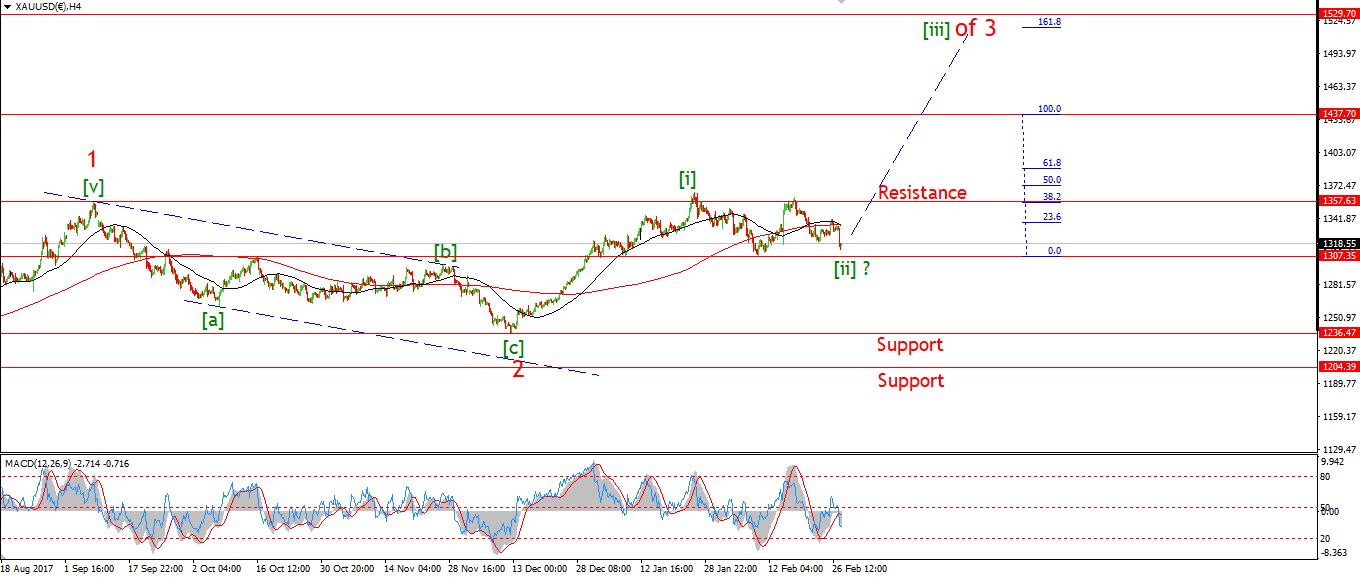
GOLD has reached the target at 1307, The price is also sitting at trend channel support at two degrees of trend. And so far, This level seems to have found a bid.
Wave [ii] is now bottoming and we should see a spike in price over the next few sessions to kick off wave [iii] green. Gold is now looking very attractive on the long side again.
Tomorrow; Watch for the formation of an impulse wave structure higher in wave 'i' brown, A break of the previous wave 'b' will indicate that the price has begun a rally in wave [iii] green.
U.S CRUDE OIL
30 min
4 Hours
Daily
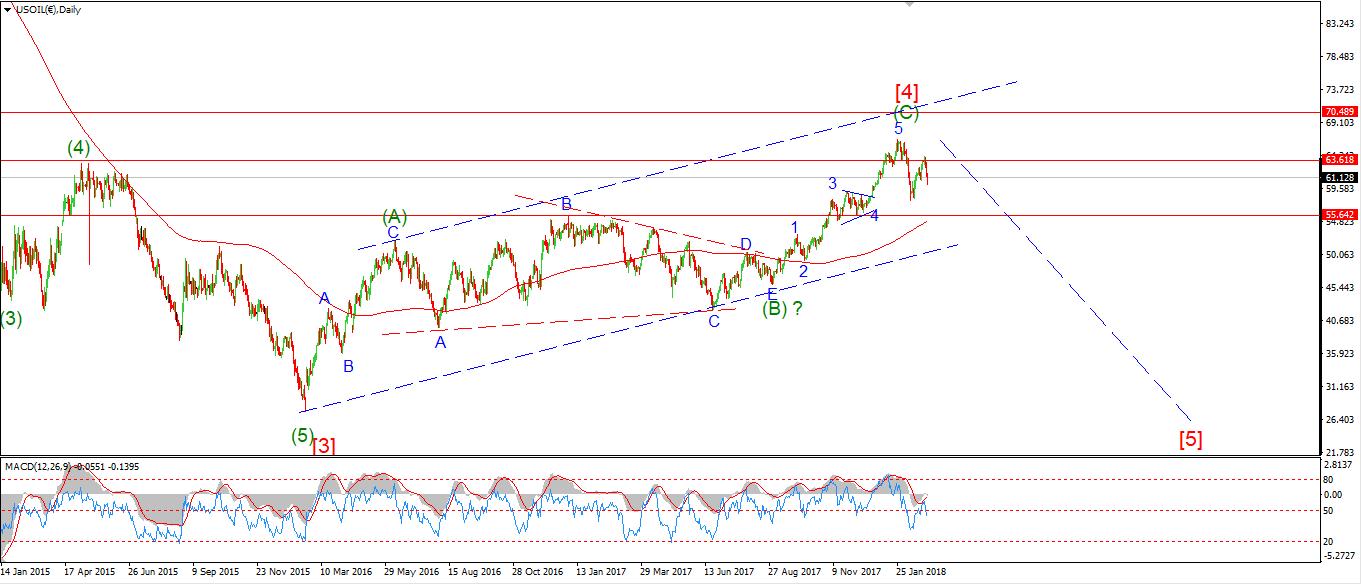
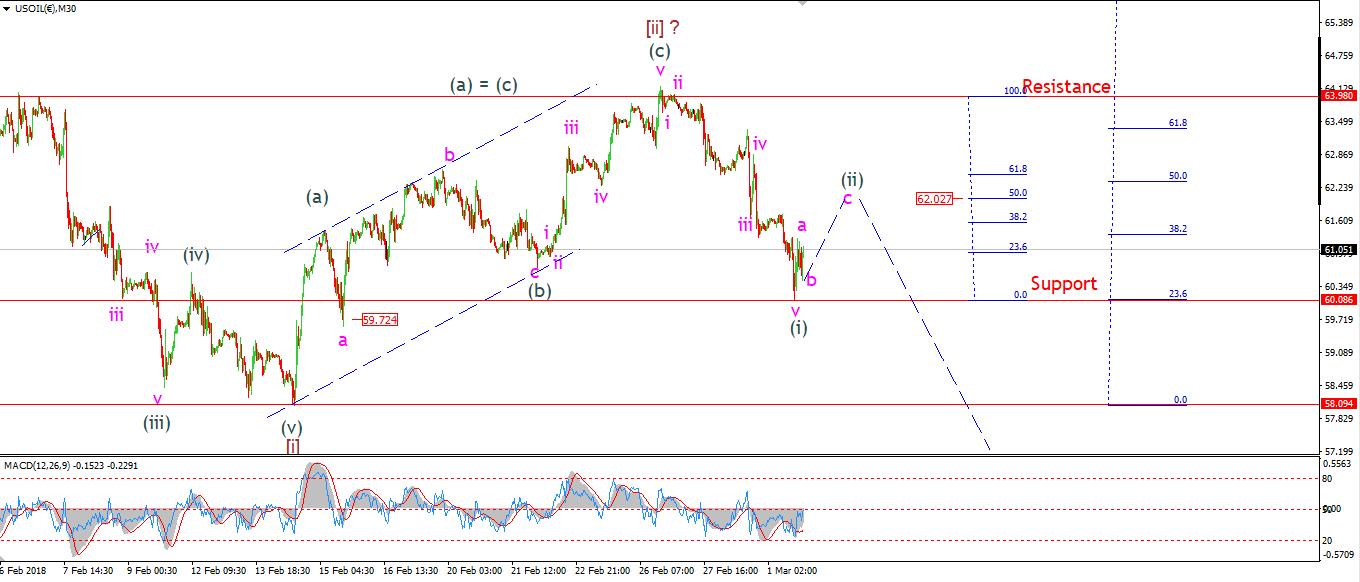
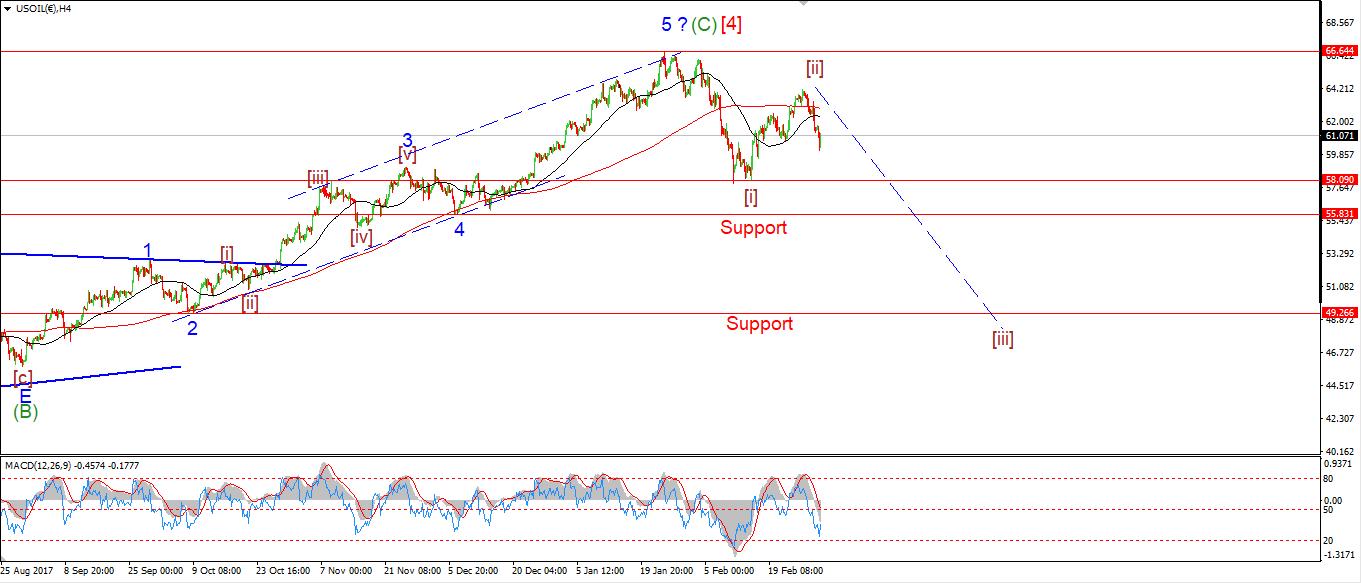
My Bias: topping in a large correction wave [4]. Wave Structure: Double combination higher in wave [4] red. Long term wave count: wave [4] target $63 - $70
Crude is in much the same position as the DOW right now. We have a larger degree Elliott wave signal complete off the high, And now a smaller degree signal has almost formed in wave (ii) grey.
Wave (ii) grey should carry the price back into about 62.00 to complete. This is the 50% retracement level of the decline in wave (i) grey. Wave (ii) will also complete a bearish head and shoulders pattern.
The 4hr chart shows that the price has declined through both the 50 and 200MA lines. The odds are lining up in favor of a large decline in wave [iii] to begin soon.
Tomorrow; I have shown that wave 'a' has possible completed at todays high, with wave 'b' underway. Wave 'c' is projected to 62.00 and that should complete the bearish signal in crude. Next week is looking interesting on the short side for Crude.
Read more by Enda Glynn


