Wednesday's trading session was quite bullish as stocks extended their recent move up following Producer Price Index number release, among others. The market got closer to its mid-April local high after bouncing off medium-term upward trend line last week. Is this a new uptrend or just more sideways action after January - February sell-off? There are still two possible medium-term scenarios.
The U.S. stock market indexes gained between 0.7% and 1.0% on Wednesday, extending their recent move up, as investors reacted to economic data releases, among others. The S&P 500 index reached 2,700 mark, as it got closer to its mid-April local high. It is currently 6.1% below January 26 record high of 2,872.87. The Dow Jones Industrial Average gained 0.8%, and the technology Nasdaq Composite gained 1.0% yesterday.
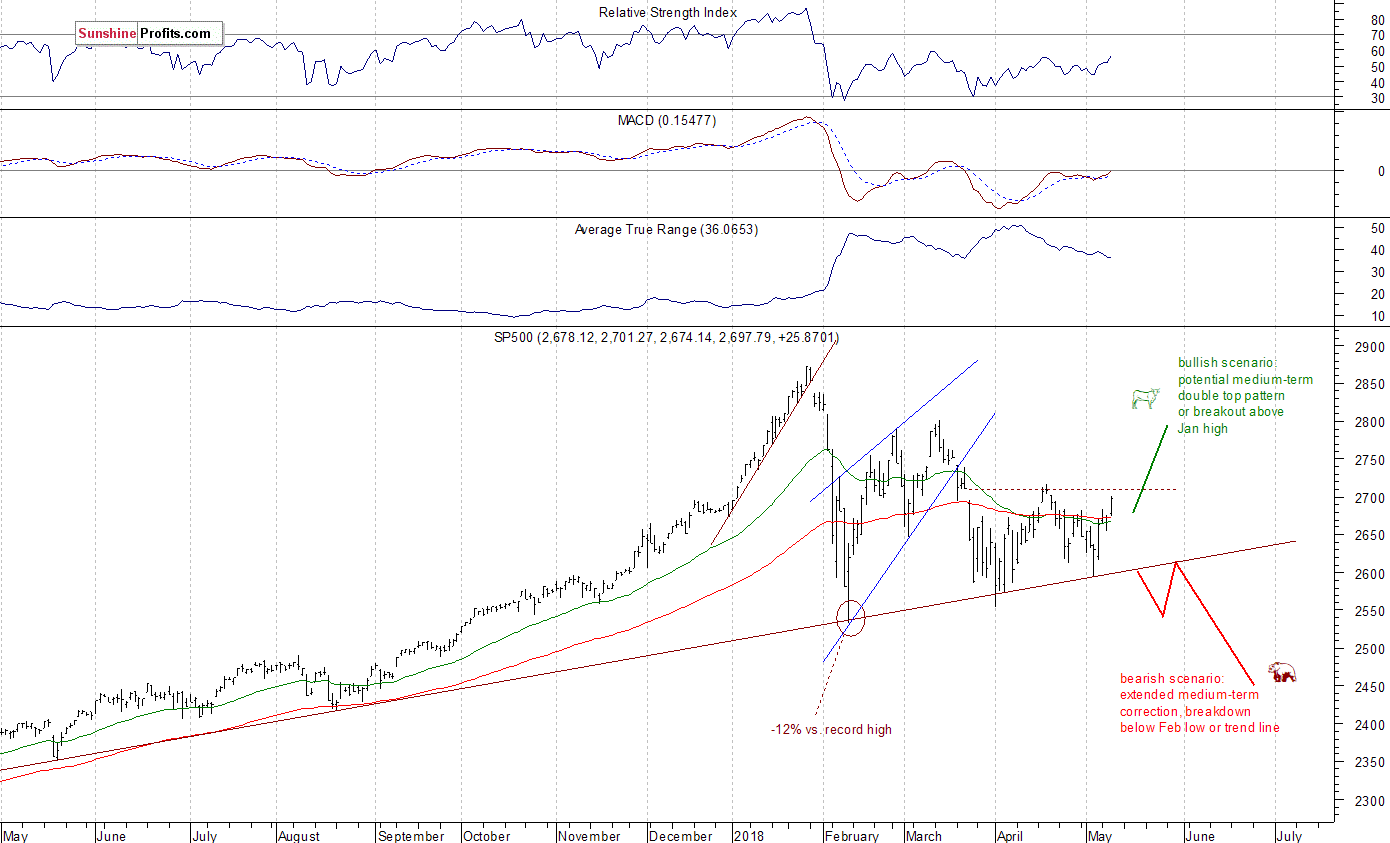
The nearest important level of resistance of the S&P 500 index is at around 2,700-2,710, marked by March 22 daily gap down of 2,695.68-2,709.79. The next resistance level is at around 2,740, marked by some March local high. On the other hand, support level is now at 2,685, marked by recent resistance level. The support level is also at 2,675, marked by yesterday's daily low.
The broad stock market continues its medium-term consolidation following late January - early February sell-off. There are still two possible medium-term scenarios - bearish that will lead us below February low following trend line breakdown, and the bullish one in a form of medium-term double top pattern or breakout towards 3,000 mark. There is also a chance that the market will just go sideways for some time, and that would be positive for bulls in the long run (some kind of an extended flat correction):
Mixed Expectations, Profit-Taking Action Ahead?
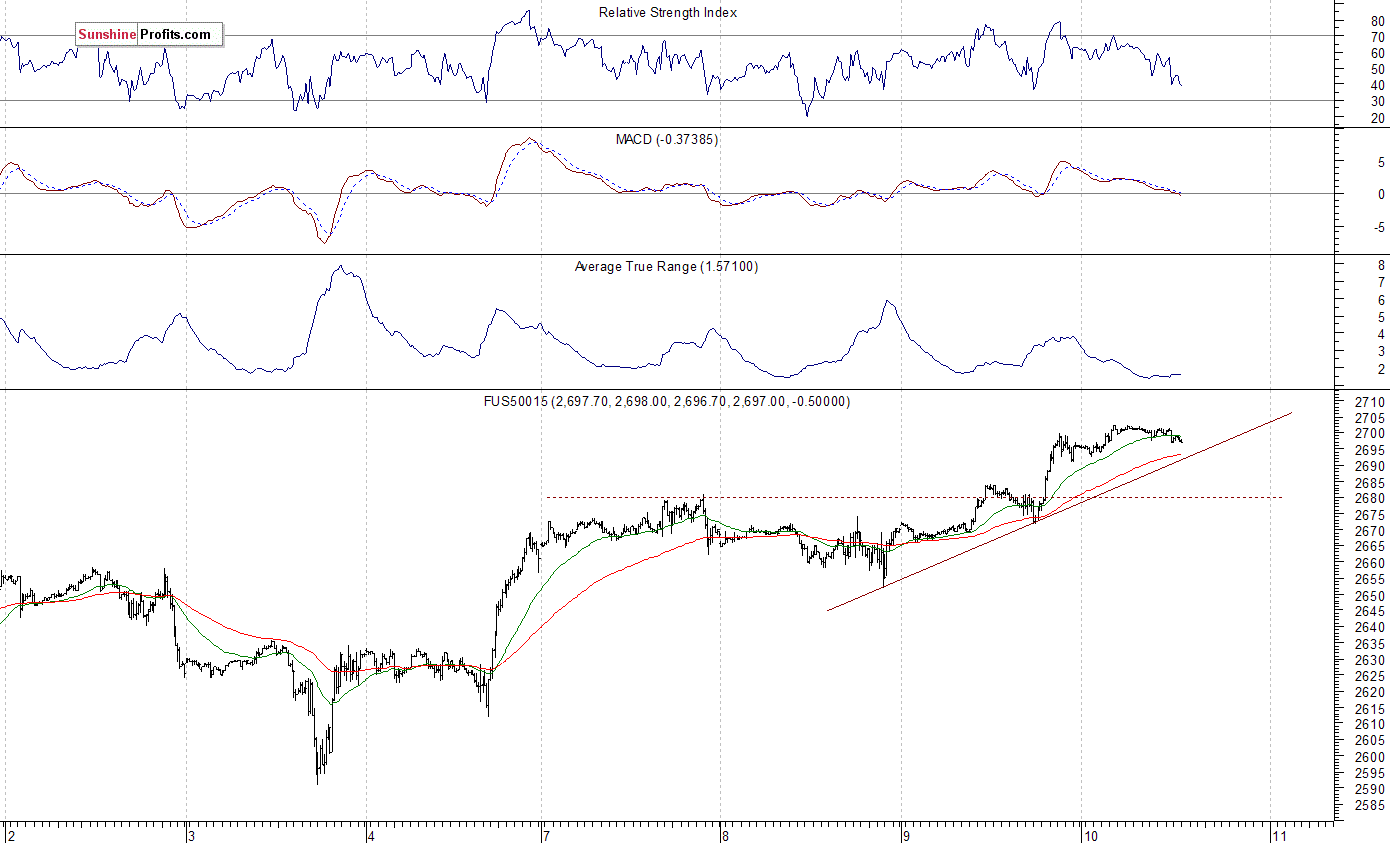
The index futures contracts trade between -0.1% and +0.1% vs. their yesterday's closing prices. So, expectations before the opening of today's trading session are virtually flat. The European stock market indexes have been mixed so far. Investors will wait for some economic data announcements: Consumer Price Index, Initial Claims at 8:30 a.m. The broad stock market will probably fluctuate after its recent rally today. There may be some profit-taking action following yesterday's breakout above short-term local highs. We will likely see some selling pressure at the above-mentioned resistance level of 2,700-2,710. There have been no confirmed negative signals so far. The S&P 500 futures contract trades within an intraday consolidation, as it fluctuates after moving up yesterday. The nearest important level of resistance is at around 2,700. On the other hand, support level is now at 2,680-2,685, marked by recent resistance level. The support level is also at 2,670. The futures contract trades close to the level of 2,700 this morning, as the 15-minute chart shows:
Nasdaq at 6,900 Mark
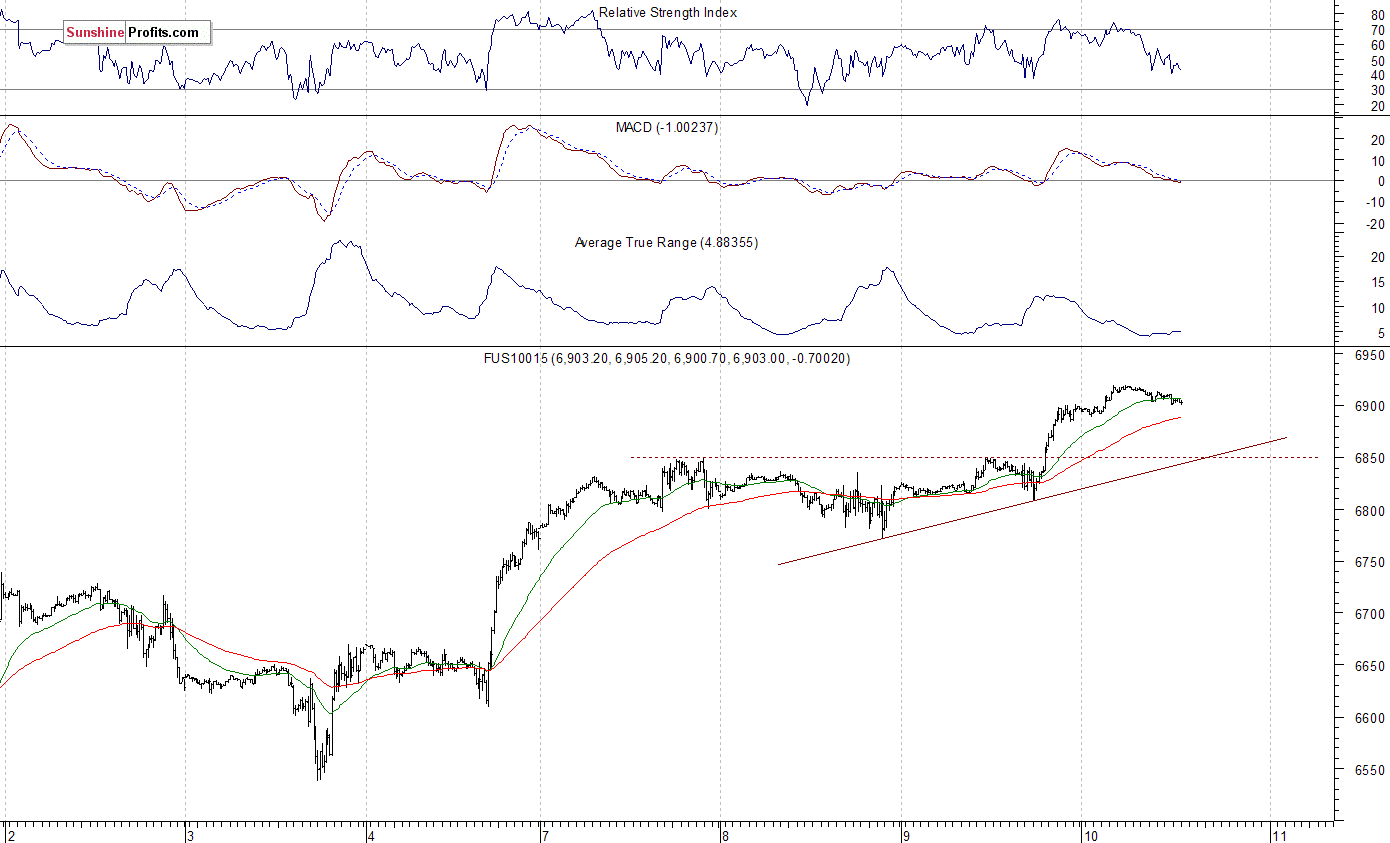
The technology Nasdaq 100 futures contract follows a similar path, as it trades within an intraday consolidation. The market fell closer to 6,500 mark on Thursday a week ago, and then it reversed its short-term downtrend and continued higher. It is trading along the level of 6,900 this morning, so volatility is back again. Potential resistance level is at around 6,950-6,700. On the other hand, support level is at 6,850, marked by recent level of resistance. The Nasdaq futures contract remains above its short-term upward trend line, as we can see on the 15-minute chart:
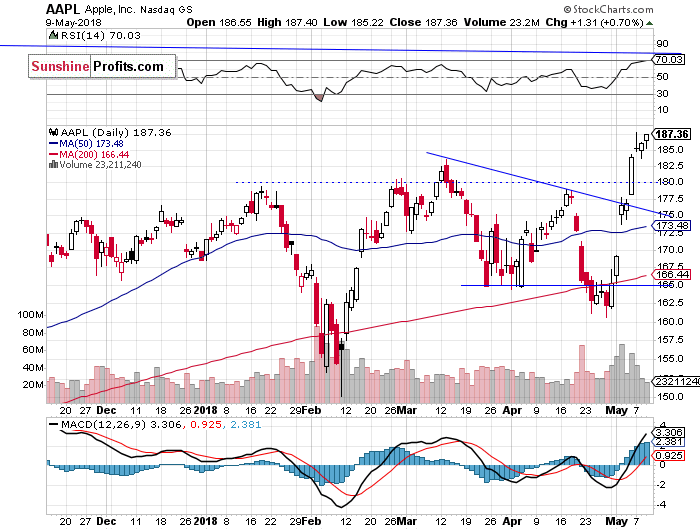
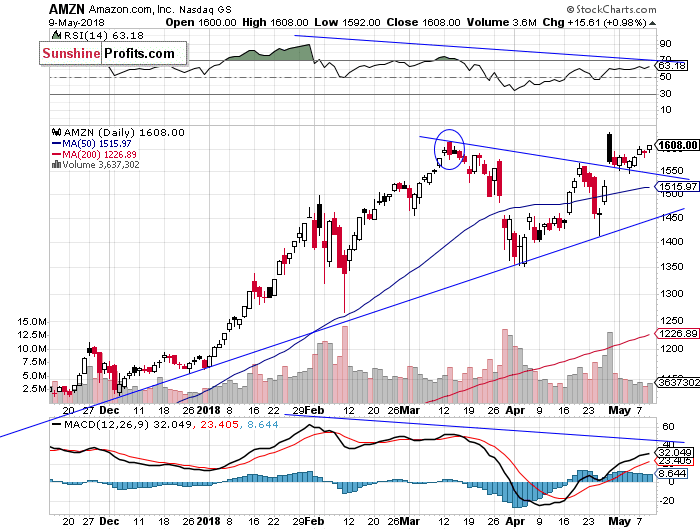
Apple, Amazon Closer to Record Highs
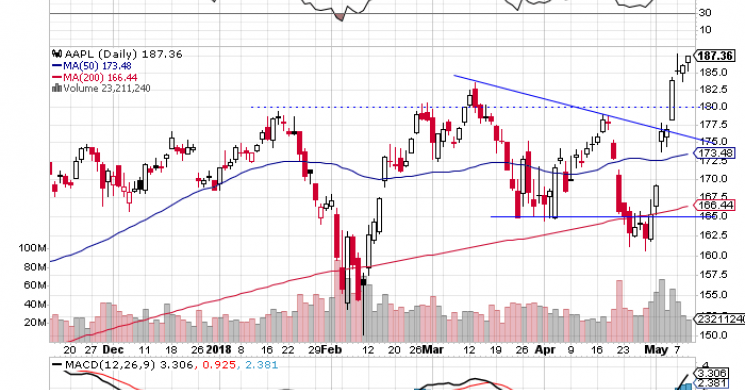
Let's take a look at Apple, Inc. stock (AAPL) daily chart (chart courtesy of http://stockcharts.com). It reached new record high on Monday, and then we saw some profit-taking action. The stock got closer to record high again on Wednesday. There have been no confirmed negative signals so far. But will it continue even higher? Potential resistance level is at $190-200. On the other hand, support level is at $180-185, marked by previous high:
Now let's take a look at Amazon.com, Inc. stock (AMZN) daily chart. The price reached new record high in the late April, as investors reacted to better-than-expected quarterly earnings release. Then, on the same trading day it sold off below $1,600. Was this a downward reversal or just correction following breakout higher? The recent price action looks pretty bullish:
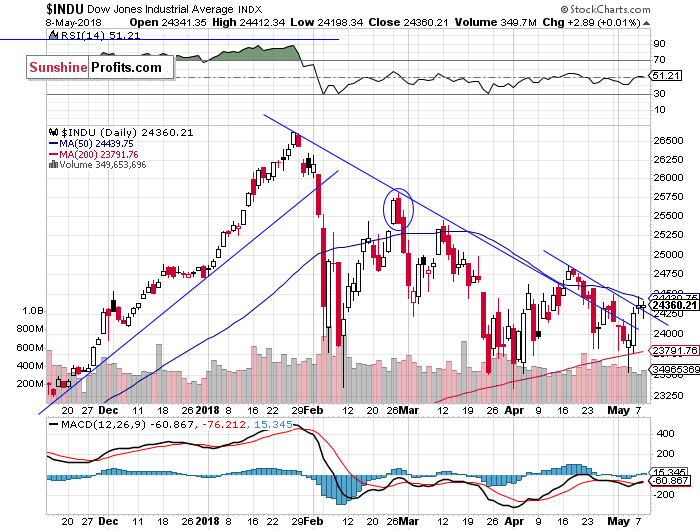
Dow Jones Breaks Higher
The Dow Jones Industrial Average broke above its medium-term downward trend line recently. Then it continued higher above a few-week-long downward trend line. It seems that the blue-chip index will test the resistance level of 25,000 again. On the other hand, support level remains at around 23,800-24,000:
The broad stock market extends its medium-term consolidation following the early February sell-off. Just like we wrote in our several Stocks Trading Alerts, the early February sell-off set the negative tone for weeks or months to come. Stocks rallied on better-than-expected big cap tech companies' earnings releases recently, but they came back lower after last week's Wednesday's FOMC Statement release. They resumed their uptrend on Friday, following monthly jobs data release, Apple's stock price rally. The market continued higher on Monday and yesterday. However, the S&P 500 index may pause, as it gets closer to 2,700 mark.
Concluding, the S&P 500 index will probably fluctuate after yesterday's move up. The broad stock market is expected to open virtually flat today. Is this a short-term topping pattern? Probably not. It looks like some flat correction within an uptrend. There have been no confirmed negative signals so far.
If you enjoyed the above analysis and would like to receive free follow-ups, we encourage you to sign up for our daily newsletter – it’s free and if you don’t like it, you can unsubscribe with just 2 clicks. If you sign up today, you’ll also get 7 days of free access to our premium daily Gold & Silver Trading Alerts. Sign me up!
Thank you.
Paul Rejczak Stock Trading Strategist Stock Trading Alerts Sunshine Profits - Free Stock Market Analysis
Read more by MarketSlant Editor


