Stocks slightly extended their downtrend on Friday despite a long-holiday-weekend shortened trading session. The S&P 500 index traded closer to its late October low. Will it reverse upwards off the support level?
The U.S. stock market indexes lost 0.5-0.7% on Friday, as investors' sentiment remained bearish following the recent declines. The S&P 500 index fell slightly below its Tuesday's local low. It got closer to the late October low of 2,603.54. The index is currently trading 10.6% below September the 21st record high of 2,940.91. The Dow Jones Industrial Average lost 0.7% and the Nasdaq Composite lost 0.5% on Friday.
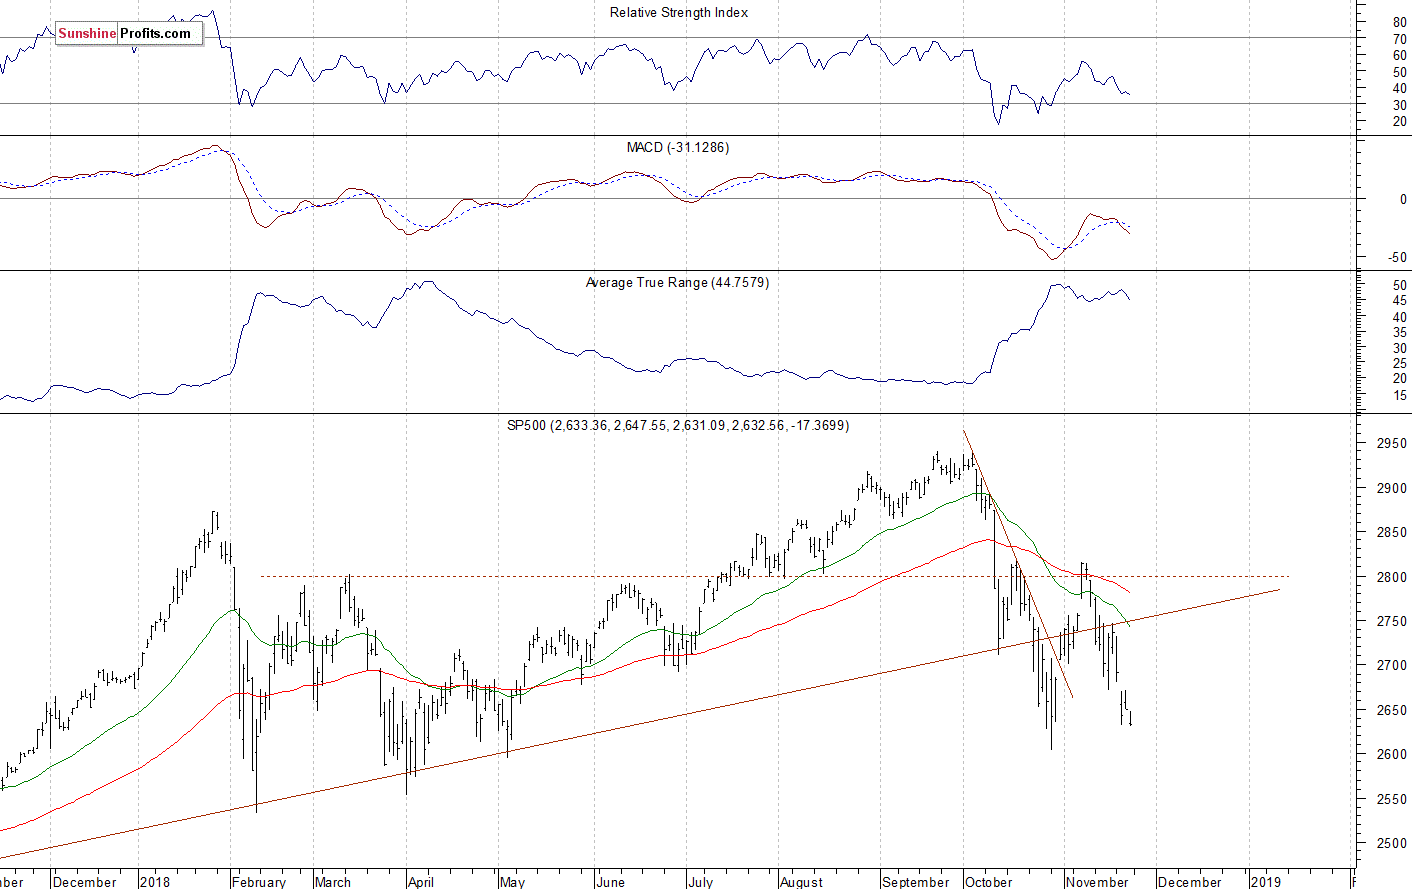
The nearest important level of resistance of the S&P 500 index is now at 2,645-2,650, marked by Friday's daily gap down of 2,647.55-2,649.82. The next resistance level is at 2,670-2,680, marked by Tuesday's daily gap down of 2,669.44-2,681.09. The resistance level is also at 2,690-2,700, marked by the previous level of support. On the other hand, the level of support is at 2,600-2,630, marked by the late October lows, among others.
The broad stock market got closer to its late October low once again. The S&P 500 index trades around 10% below the record high. So will the downtrend continue? Or is this a bottoming pattern before an upward reversal? There have been no confirmed positive signals so far. The market continues to trade below its long-term upward trend line, as we can see on the daily chart:
Positive Expectations
Expectations before the opening of today's trading session are positive, because the index futures contracts trade 1.1-1.6% above their Friday's closing prices. The European stock market indexes have gained 0.9-1.3% so far. There will be no new important economic data releases today. The broad stock market will likely retrace some of its last week's sell-off. For now, it looks like an upward correction within a downtrend.
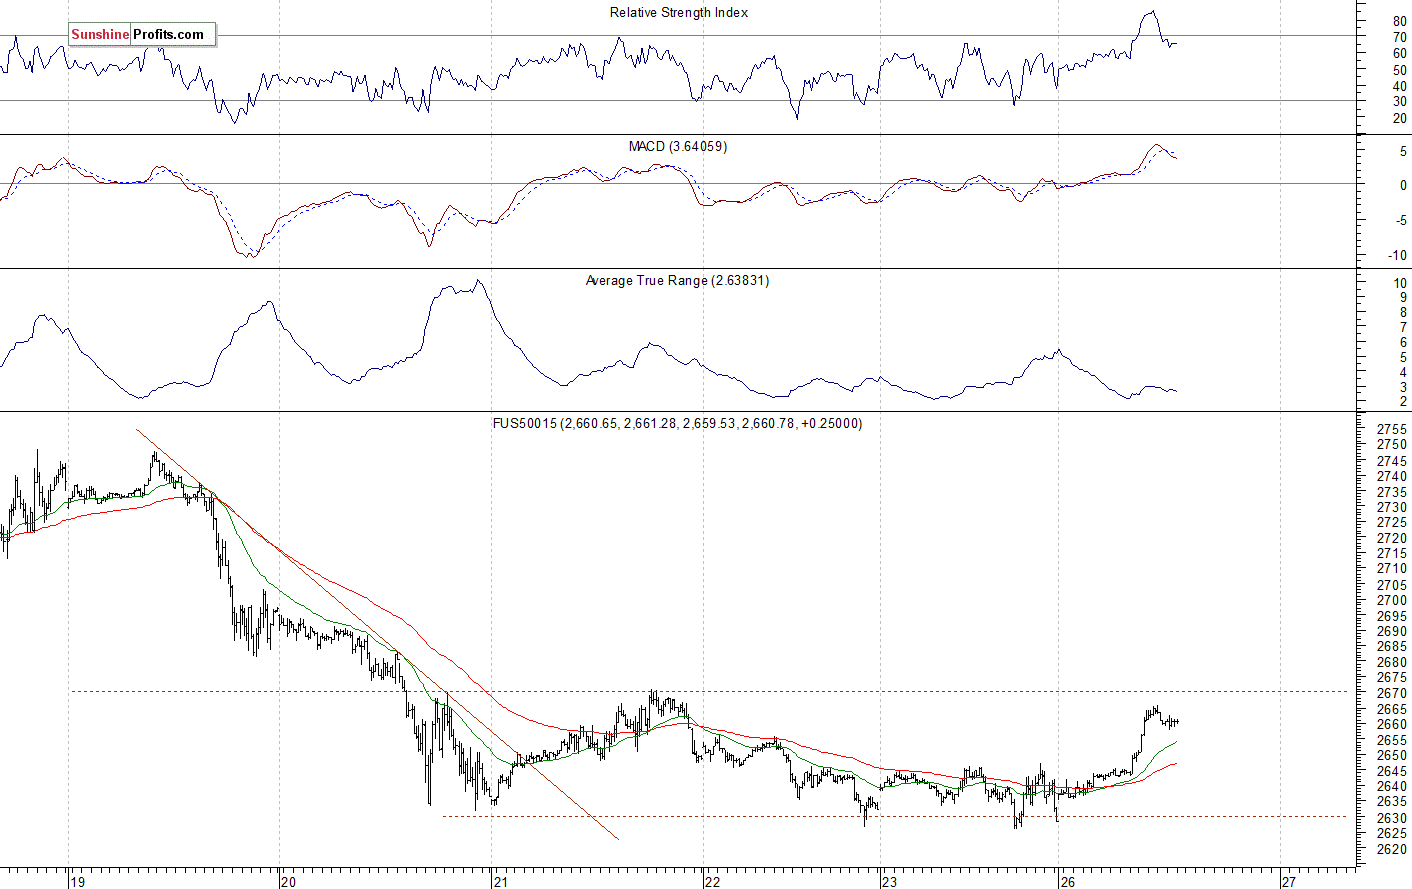
The S&P 500 futures contract trades within an intraday uptrend. The nearest important level of resistance is at around 2,660-2,665, marked by the recent local highs. The next resistance level is at 2,680-2,700. On the other hand, the level of support is at 2,630-2,640, marked by the recent consolidation. The futures contract extends its short-term consolidation, as we can see on the 15-minute chart:
Nasdaq Also Higher
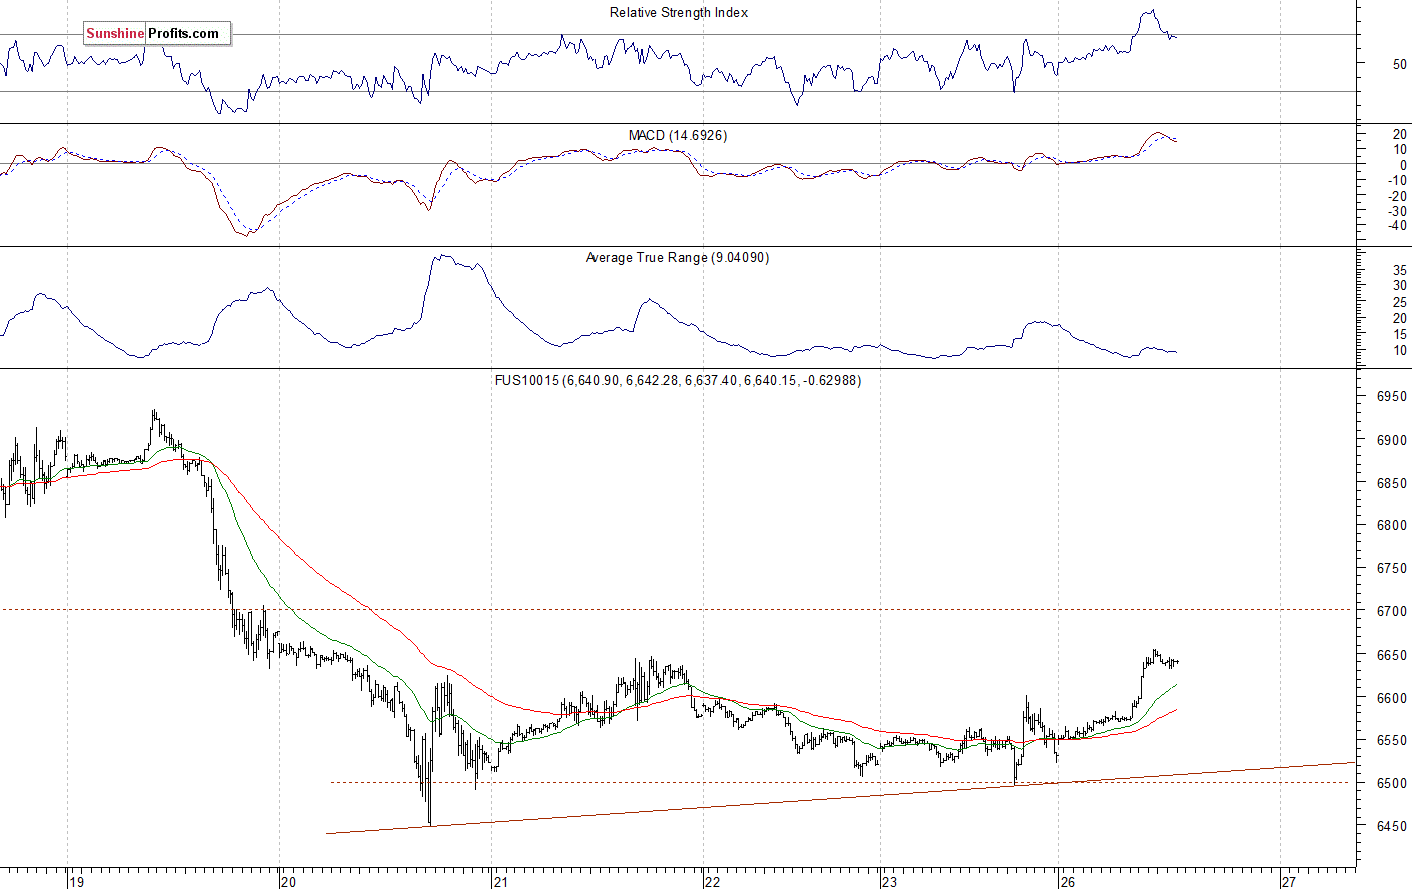
The technology Nasdaq 100 futures contract follows a similar path, as it trades within an intraday uptrend. The tech stocks' gauge accelerated the downtrend on last week's Tuesday and it reached the new low of around 6,450. It was the lowest since the late April. Then the market fluctuated along the level of 6,500-6,550. This morning it reaches the resistance level of 6,600-6,650. The Nasdaq futures contract is at it Wednesday's local highs, as the 15-minute chart shows:
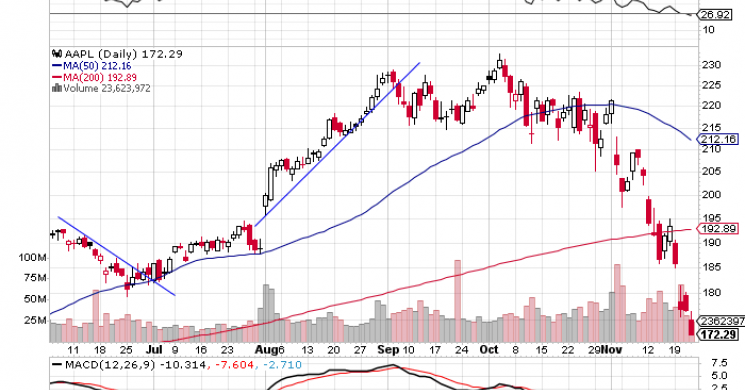
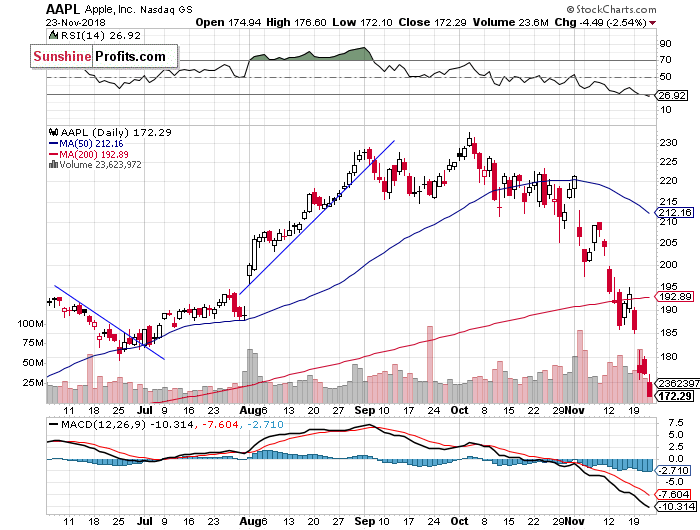
Apple Extends the Sell-Off, Amazon Remains at $1,500
Let's take a look at Apple, Inc. stock (AAPL) daily chart (chart courtesy of http://stockcharts.com). The stock accelerated its sell-off on Friday following Tuesday's breakdown below the support level of $185-190. The market may have reached a temporary bottom of around $170-175. However, there have been no confirmed positive signals so far:
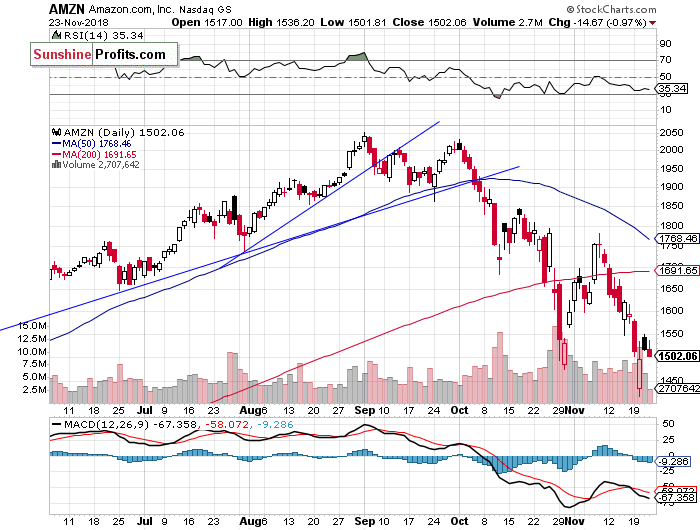
Now let's take a look at Amazon.com, Inc. stock (AMZN) daily chart. It remained relatively stronger on Friday, as it traded above the Tuesday's local low. On Tuesday, the stock fell closer to the price of $1,400, before rebounding off the support level. Was it an upward reversal? The market remains at the important resistance level of $1,500:
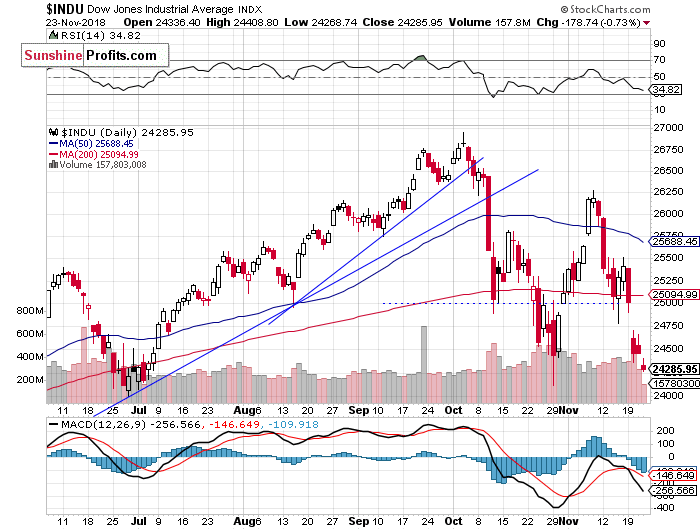
Dow Jones Still Close to Local Lows
The Dow Jones Industrial Average broke below 25,000 mark on Tuesday and then it fluctuated along the late October low and the support level of 24,000-24,200. Will it break below that support level? We can see some short-term oversold conditions, but it doesn't look like a potential upward reversal. The resistance level is now at 25,000:
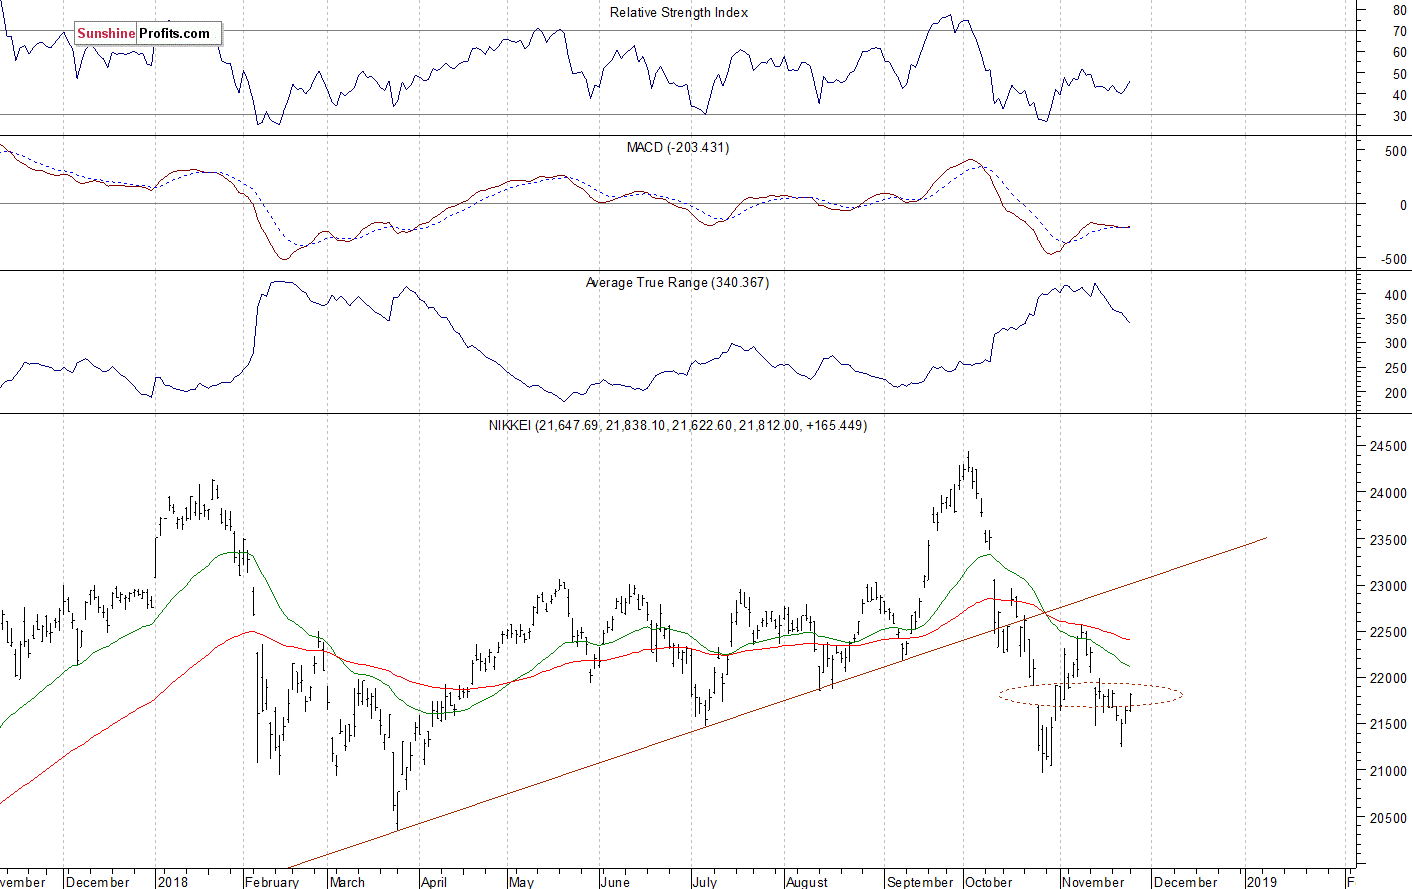
Japanese Nikkei Slightly Higher
Let's take a look at the Japanese Nikkei 225 index now. It retraced more of its October sell-off in the early November, but then it failed to continue higher following bouncing off the resistance level at 22,500. The Nikkei continues to trade below its broken long-term upward trend line. The index retraced some more of the recent sell-off today, so we can see a short-term upward reversal:
The S&P 500 index slightly extended its short-term downtrend on Friday and it traded closer to a potential support level of 2,600-2,630, marked by the late October local lows. We can see some short-term oversold conditions that may lead to an upward correction. However, there have been no confirmed positive signals so far.
Concluding, the S&P 500 index will likely open higher today. For now, it looks like an upward correction within a downtrend. But if the market breaks above the resistance level of around 2,670-2,680, we could see more buying pressure.
If you enjoyed the above analysis and would like to receive free follow-ups, we encourage you to sign up for our daily newsletter – it’s free and if you don’t like it, you can unsubscribe with just 2 clicks. If you sign up today, you’ll also get 7 days of free access to our premium daily Gold & Silver Trading Alerts. Sign up today!
Thank you.
Paul Rejczak Stock Trading Strategist Stock Trading Alerts Sunshine Profits - Free Stock Market Analysis
Read more by MarketSlant Editor