Stocks rallied on Wednesday following the Fed's Rate Decision announcement. The broad stock market extended its month-long advance, as the S&P 500 index got closer to the 2,700 mark. Will the uptrend continue today?
The U.S. stock market indexes gained 1.6-2.2% on Wednesday, as investors reacted to the FOMC's Statement, quarterly corporate earnings releases. The S&P 500 index broke above its short-term consolidation and it got closer to the 2,700 mark. The market is now closer to the 61.8% Fibonacci retracement of its October-December downward correction of 20.2% (2,713.88). It has gained more than 340 points from the late December medium-term low, but it is still around 260 points below the September 21st record high of 2,940.91. The Dow Jones Industrial Average gained 1.8% and the Nasdaq Composite gained 2.2% yesterday.
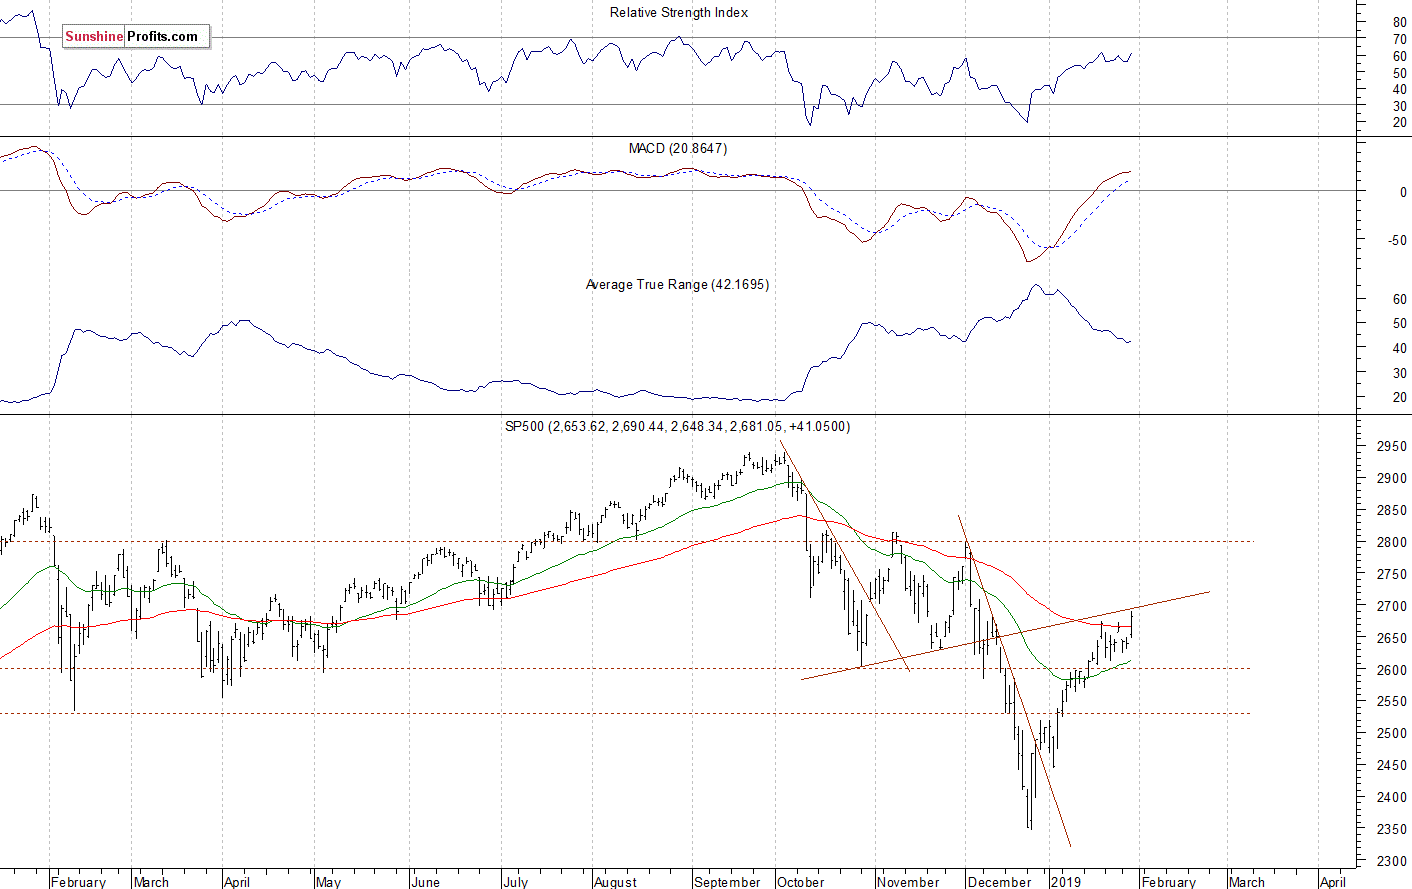
The nearest important resistance level of the S&P 500 index is now at 2,700-2,720, marked by the mentioned 61.8% Fibonacci retracement. The resistance level is also at 2,750-2,760. On the other hand, the support level is at 2,650, marked by the recent fluctuations. The support level is also at 2,615-2,625, marked by the short-term local lows.
The broad stock market broke below its two-month-long trading range in the mid-December, as the S&P 500 index fell below the level of 2,600. Then the market accelerated lower and it broke below the 2,400 mark. Since then, the market has retraced more than 50% of the whole decline off the September high. The index trades close to a possible resistance level of its previously broken upward trend line, as we can see on the daily chart:
Pause After Rallying
The index futures contracts trade between -0.1% and +0.5% vs. their yesterday's closing prices. So expectations before the opening of today's trading session are mixed following yesterday's run-up. The European stock market indexes have been mixed so far. Investors will wait for some economic data announcements today: Initial Claims at 8:30 a.m., Chicago PMI at 9:45 a.m., New Home Sales at 10:00 a.m. Investors will also wait for the quarterly corporate earnings releases. The broad stock market will likely fluctuate along the mentioned resistance level following yesterday's rally. There have been no confirmed negative signals so far. However, we can see some short-term technical overbought conditions.
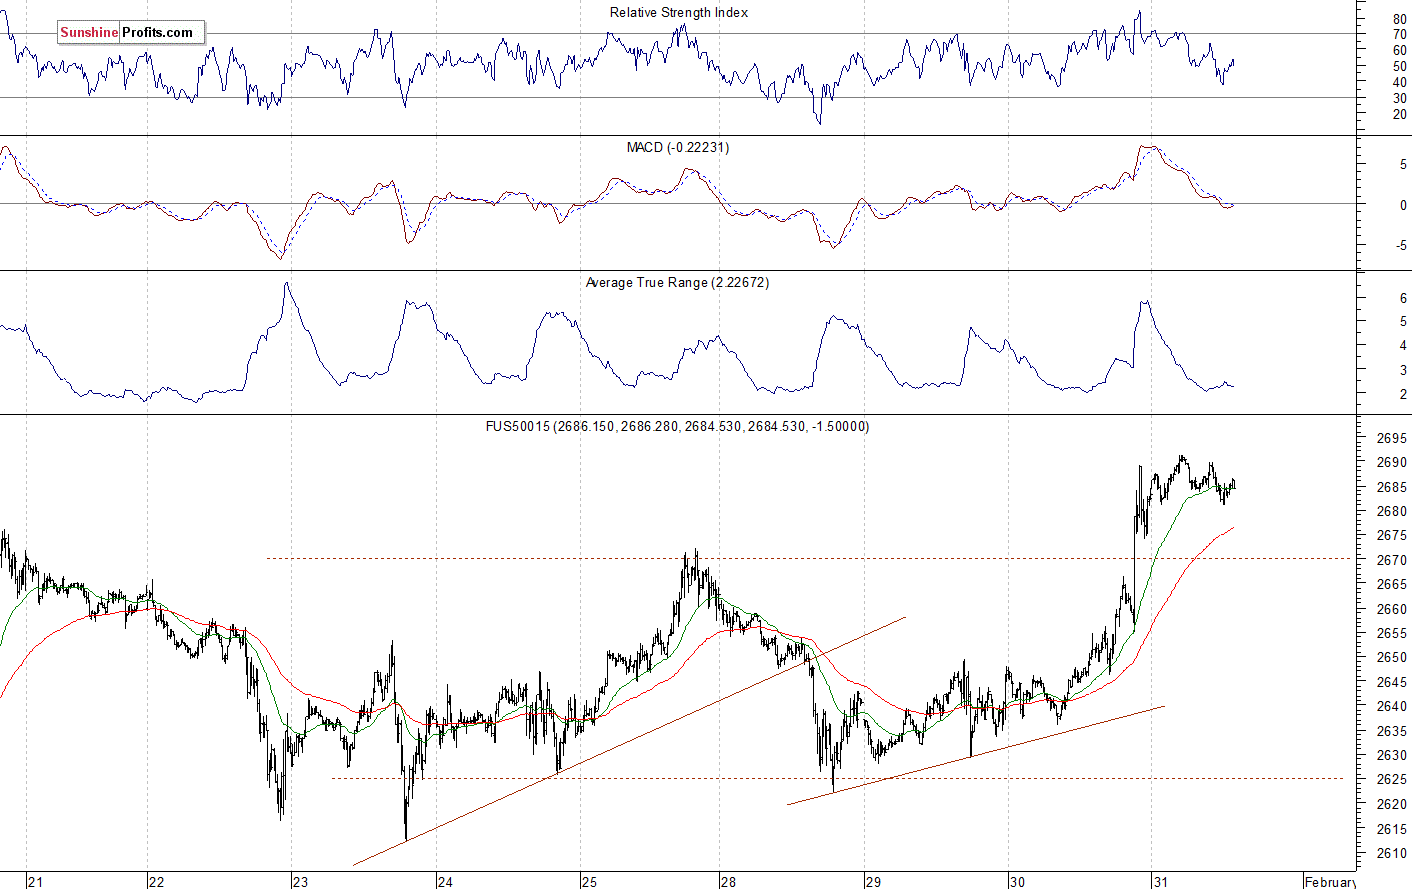
The S&P 500 futures contract trades within an intraday consolidation following yesterday's advance. The nearest important resistance level is at 2,690-2,700. On the other hand, the support level remains at 2,660-2,670, among others. The futures contract is above the recent local highs, as the 15-minute chart shows:
Nasdaq Closer to 6,900
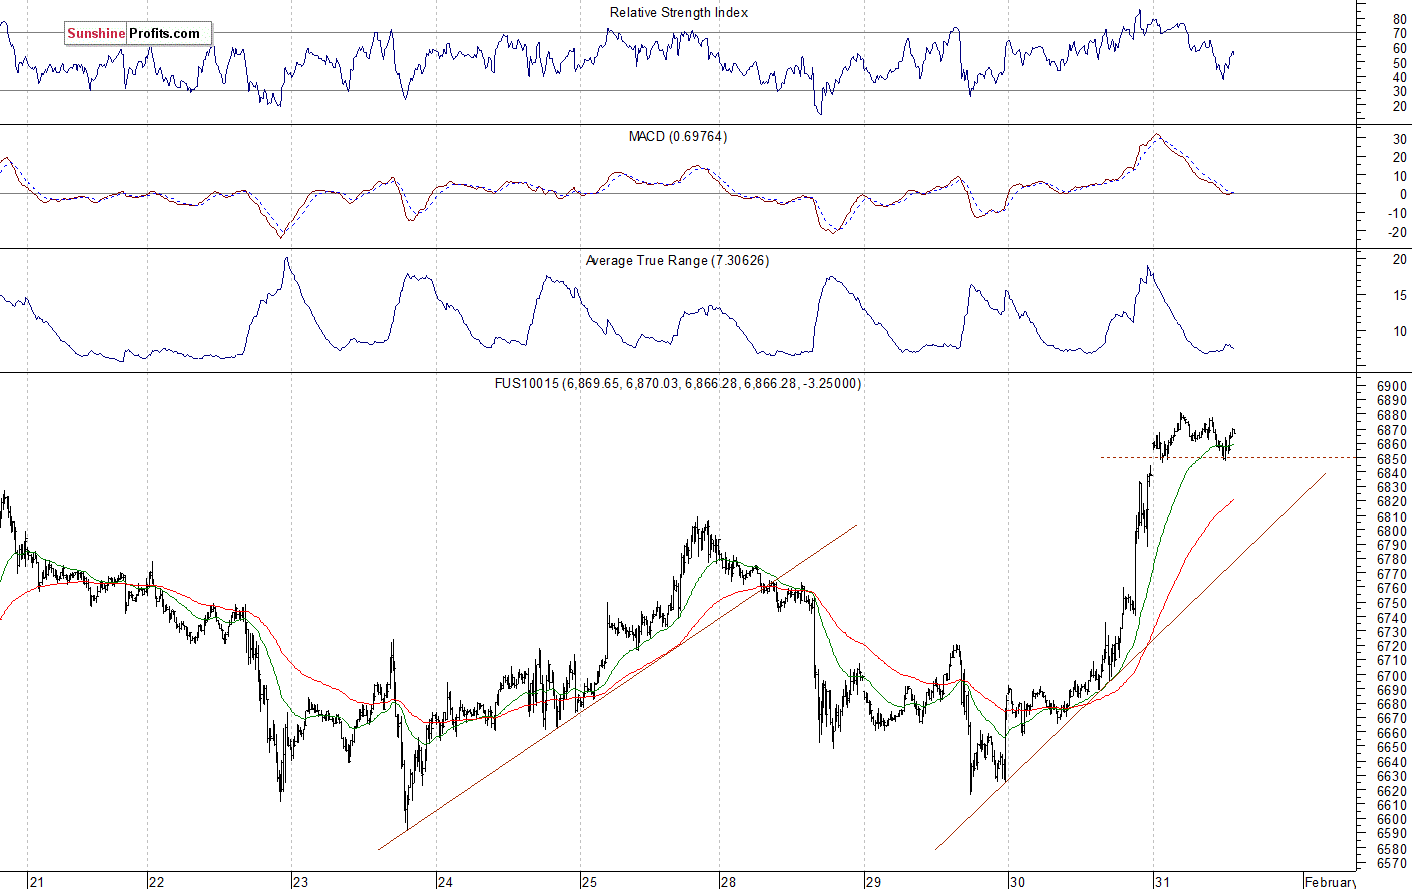
The technology Nasdaq 100 futures contract follows a similar path, as it trades within an intraday consolidation after rallying yesterday. The market gained over 1,050 points from December the 26th local low of around 5,820 in the recent weeks. The nearest important resistance level is now at 6,900-7,000. The support level is at 6,800-6,820, marked by the recent consolidation. The Nasdaq futures contract remains within a relatively narrow trading range this morning, as we can see on the 15-minute chart:
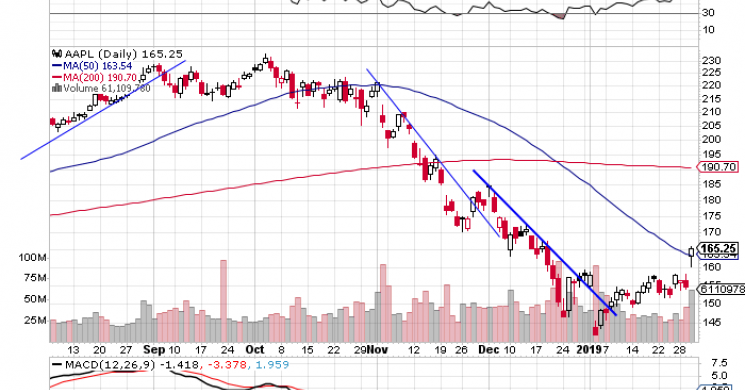
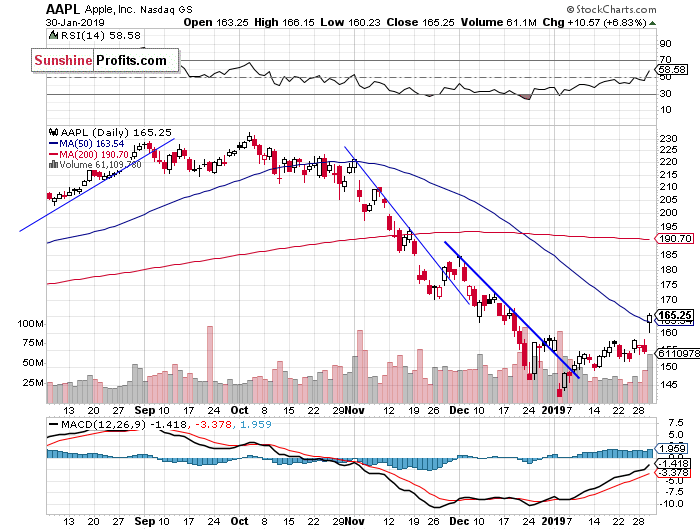
Apple Rallies After Earnings Release, New Uptrend or Just Upward Correction?
Let's take a look at the Apple, Inc. stock (AAPL) daily chart (chart courtesy of http://stockcharts.com). Apple released its quarterly earnings on Tuesday after the trading session's close. Then the stock broke above its recent trading range and the resistance level of $155-160. It retraced some more of its November-December sell-off. The next possible resistance level is at $170:
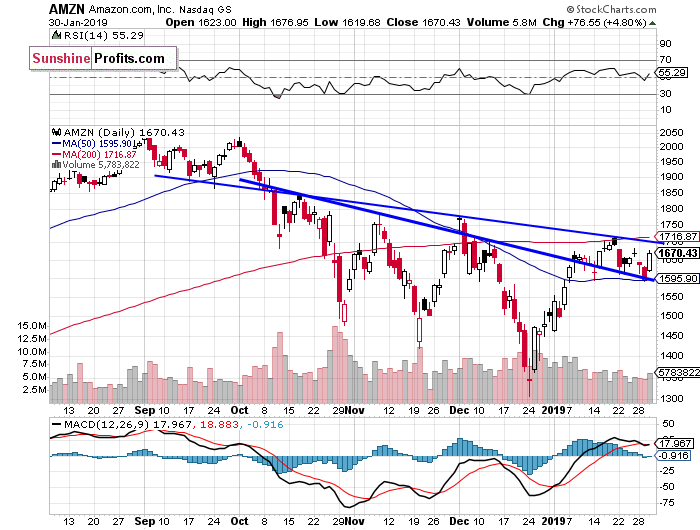
Now let's take a look at the daily chart of Amazon.com, Inc. (AMZN). The market broke above one of its three-month-long downward trend lines recently. Since then it goes sideways. There is a resistance level at around $1,700-1,750. On the other hand, the support level remains at $1,550-1,600:
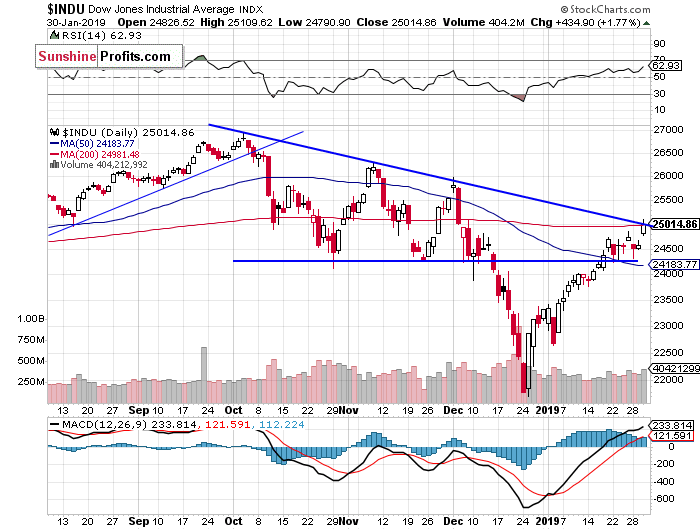
Dow Jones at the Trend Line
The Dow Jones Industrial Average extended its short-term uptrend yesterday, and it got closer to the medium-term downward trend line. So will it continue higher and reach the record high again? Or reverse lower in the near term? There have been no confirmed negative signals so far. However, the resistance level remains at around 25,000:
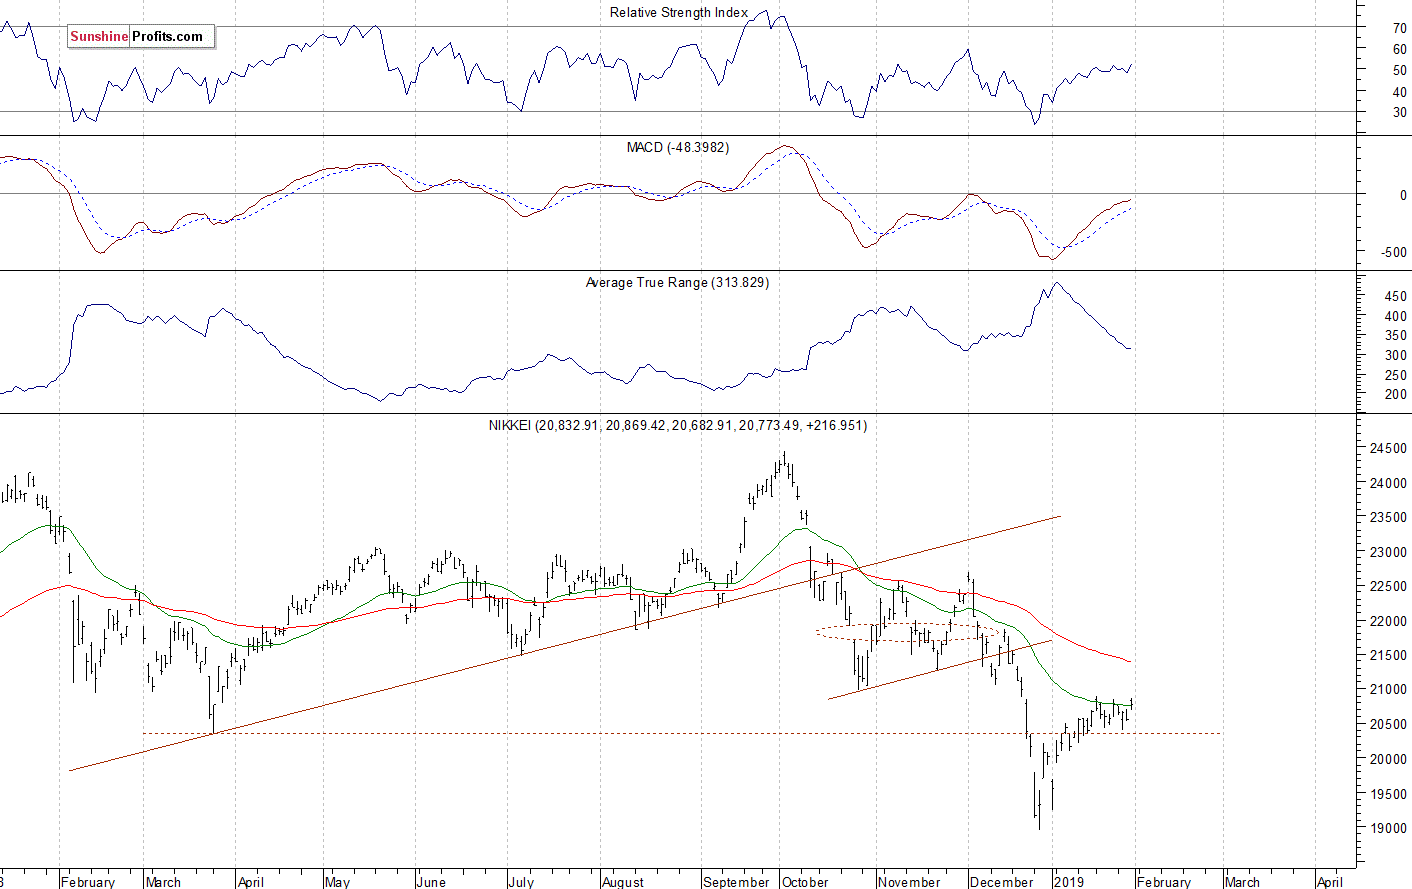
Japanese Nikkei Still Relatively Weak
Let's take a look at the Japanese Nikkei 225 index. It accelerated the downtrend in late December, as it fell slightly below the level of 19,000. Since then it has been retracing the downtrend. Recently we saw an advance above the level of 20,000. For now, it still looks like an upward correction and the Nikkei is relatively weak, as it remains below the October - November local lows:
The S&P 500 index broke above its short-term consolidation yesterday, as it gained 1.6% following the Fed's Rate Decision release. Is this a new medium-term uptrend or still just upward correction before another medium-term leg lower? The market trades above the 50% retracement of the whole medium-term decline. There have been no confirmed negative signals so far.
Concluding, the S&P 500 index will likely open virtually flat today. We may see some profit taking action. Investors will wait for tomorrow's monthly jobs data announcement and some more quarterly corporate earnings releases.
If you enjoyed the above analysis and would like to receive free follow-ups, we encourage you to sign up for our daily newsletter – it’s free and if you don’t like it, you can unsubscribe with just 2 clicks. If you sign up today, you’ll also get 7 days of free access to our premium daily Gold & Silver Trading Alerts. Sign up today!
Thank you.
Paul Rejczak Stock Trading Strategist Sunshine Profits - Effective Investments through Diligence and Care
Read more by MarketSlant Editor


