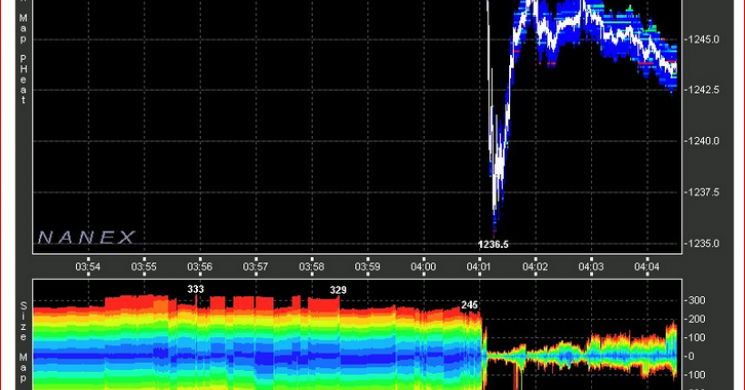
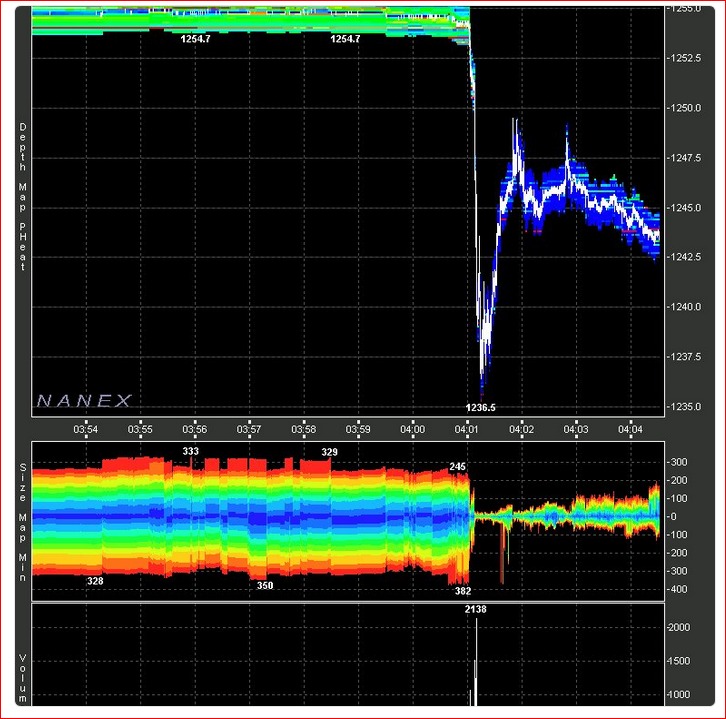
Today Gold got slammed at 4am ET. Gold suddenly plunged $18 touching $1,236 before bouncing. The volume at 18k contracts in seconds was not light. Silver was hammered in sympathy. But someone got it going in Gold.
Here is NANEX chart as pulled from their accompanying tweet.
What May Have Happened
We do not think this was someone who intended to kill Gold, but more likely a large fund that had bigger fish to fry and just did not care about slippage. That is not to say they weren't front-run by a dealing bank to make the pain worse, but this was likely a real player getting out for an upcoming event like Brexit, FOMC, or some other event where they got a margin call and just puked their Gold to meet it.
What likely happened was either a long used Globex to sell or a long with no patience for a screen called a dealer(s) and got a price on say, 15,000 lots. The dealer(s) faded him as a seller, and the customer sold him 15k at a discounted price of say, $1247. The dealer(s) who was probably pre-selling as he was on the phone sussing out the clients volume likely sold a total of 18k lots into the comex screen (the clients' 15k and his own 3k).
In fact the next hour shows about 2000 lots trading, which we'd bet in part was some of that prop trading front running closing shorts. Do we have proof? Not factual. Do we really need it? Someone sold and was either the sap who got frontrun or the sap who sold into a blind screen. And that "sap" probably was long from $1217.
The total gold sold amounted to 1.8 million ounces of gold in just a minute, roughly $2.2 billion notional, a level not reached even with the surprise election of U.S. President Donald Trump or Britain’s vote to leave the European Union according to Bloomberg.
Gold flash crashed $20 this morning. Here's a chart of price, liquidity, and volume $GC_F pic.twitter.com/iP83Sg0rIM
— Eric Scott Hunsader (@nanexllc) June 26, 2017
But that's not all. Goldman just recommended long Gold.
Goldman Sachs Just Turned Bullish on Gold (Really)
Goldman Sachs Research via zerohedge
Across asset classes last week copper was the best performing asset (+2.5%), while oil was the worst performing asset (-4.3%, Exhibit 3). Gold's performance was flat (+0.1%) over the same period, but had an intraday min at 1.6% today. Much of the focus has obviously been on oil where concerns are that expanding supply in the US and Libya will counter OPEC cuts. Gold has received less focus, although its cross-asset correlations have quietly been rising to new extremes (Exhibit 1).
Our commodity team's view is gold at $1250/oz over 12 months as higher real rates from Fed tightening could put further pressure on gold, but this may be offset by 3 things:
- lower returns in US equity (as we expect) should support a more defensive investor allocation,
- EM $GDP acceleration would add purchasing power to EM economies with high propensity to consume gold, and
- GS expects gold mine supply to peak in 2017.
Gold has been increasingly trading as a "risk off" asset, with its correlation with global bonds at the 100th percentile since 2002...
... and should thus be sensitive to our expectation of rising rates from here. However, with global growth momentum likely having peaked, gold could represent a good hedge for equity, in particular in currencies with low and anchored real yields.
Gold implied vol remains attractive for investors' of either view: it trades at its 0th percentile relative to the past 10 years (Exhibit 28).


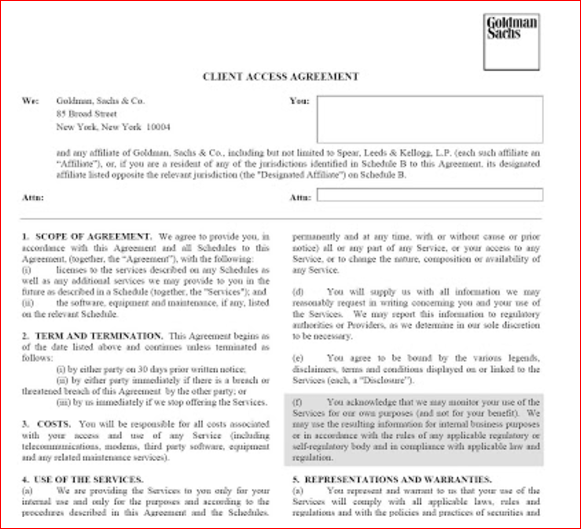
Lest we forget: Goldman Sachs is the master at creating exit liquidity for its own bigger clients and trading accounts. Remember, they actually say in their customer disclaimer that they may take opposite positions of their recommendations. While this document is admittedly years old, the culture of GS and other banks has not changed we are sure. The legal doc may have gotten more vague, but can this not be made any clearer to you as an investor: When any bank recommends a specific investment it is at best indifferent to the outcome.
And we love the Gold vol is cheap part. Nice touch when calling clients next week to tell them to buy calls. Weren't they bullish on VIx a couple months ago? Just Sayin'
A bank's goal is to make money. If that means by selling good ideas or bad it does not matter. Selling ideas is what the research side is now. Shills for the trading side. This goes way back to the Lehman split between the bankers and the traders. The traders won. And since then every bank with proprietary trading is driven by those profits over everything else.
So, while we are still sanguine about Gold going to $1550 as long as it remains above $1214. We are less so with it below $1247. And seeing Goldman recommend Gold here tells us we may as well be at $1214 right now.
Here is where we stand on Gold right now in our Project $1550 Timeline
Above $1259 Settlement Gets you $1296
- $1240 is a double bottom area that also coincides with an EW count we like on the 30 minute chart
- if normal resistance at $1259 is breached on a settlement basis $1280 should not be a problem
- The Wave count shows a $1296 target on the 30 minute chart before a pull back if $1259 holds
- The 4 hour count calls for $1350
- The Daily count calls for $1550
We are still above $1240, so if you are flat, not a bad place to buy for a bounce. But it is now a triple bottom at the $1241 area. And the saying goes " Triple bottoms are made to be broken". Translation, $1240 should not hold a 4th time down. Under $1240 waning confidence still gives $1217-$1214 area as support. We believe that the big funds who bought last time bought in this area. Those are the same guys who got out today and last week.
Here is the complete timeline on the "Project $1550" analysis.
Project $1550 Posts In Chronological Order
(Most Recent at bottom)
- MYSTERY SOLVED? GOLD OVER $1214 GIVES $1550 AS TARGET
- Project $1550 Gold: Buy Dips Above $1248
- Why Gold is Up and Why $1550 is Still The Target.
- Wave Count Hints at $1241 Bottom
- Above $1259 Settlement Gets you $1296
Read more by Soren K.Group


