Stocks rallied on Wednesday, retracing their Monday's and some of their last Friday's decline, as investors' sentiment much improved after Tuesday's holiday pause. We saw a panic-selling climax on Monday, but did the downtrend reverse?
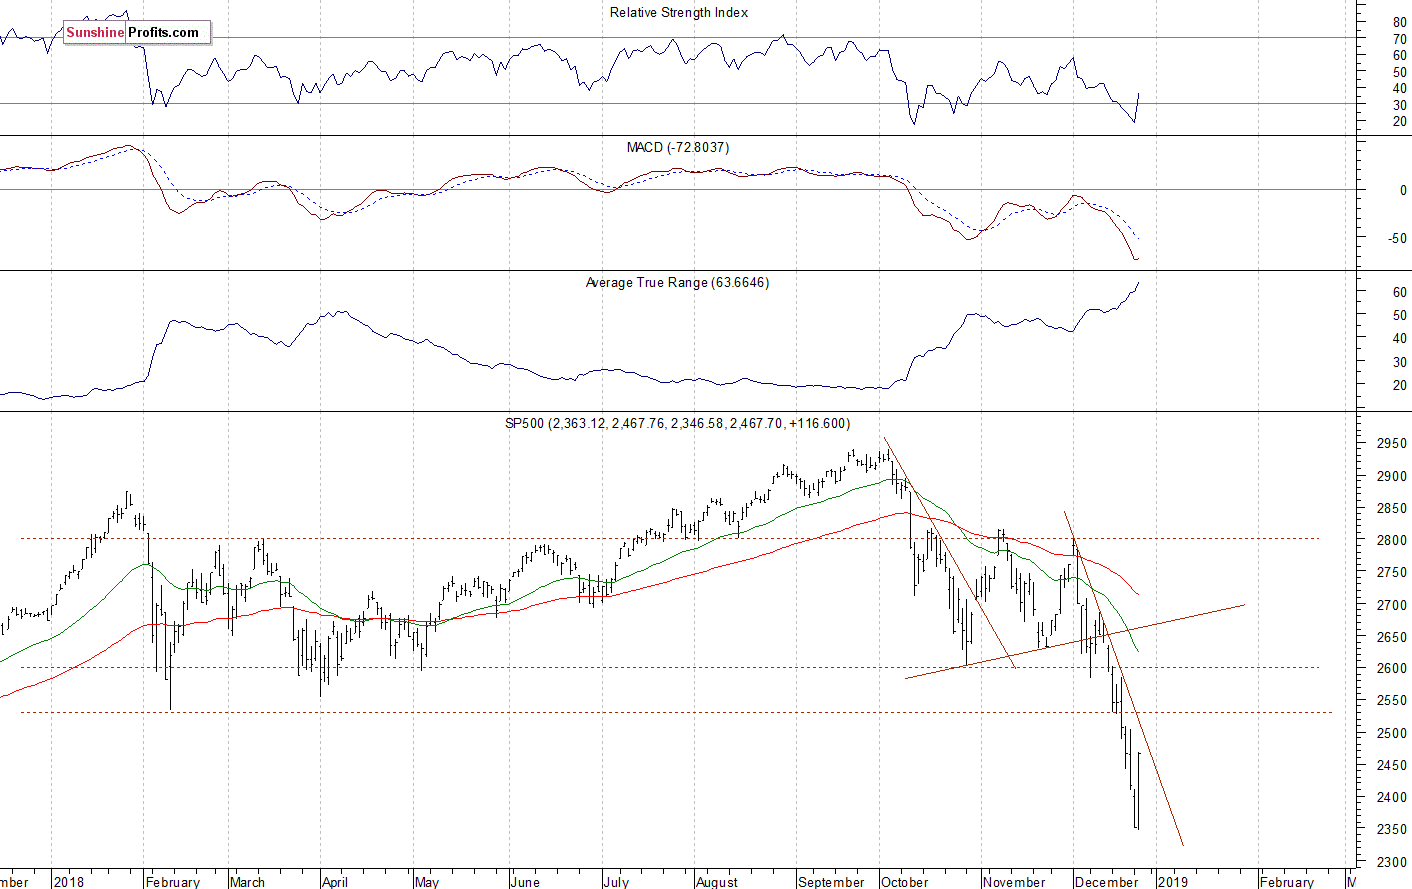
The U.S. stock market indexes gained 5.0-5.8% on Wednesday, as they retraced their Monday's sell-off and got above last Friday's closing prices. The S&P 500 index fell the lowest since the late April of 2017 and it traded 20.2% below September the 21st record high of 2,940.91 yesterday. The daily low was at 2,346.58. Then the market rallied and closed 16.1% below the mentioned record high. The Dow Jones Industrial Average gained 5.0% and the Nasdaq Composite gained 5.8% on Wednesday.
The nearest important level of resistance of the S&P 500 index is now at around 2,500, marked by the recent local highs. The resistance level is also at 2,530. On the other hand, the support level is at 2,400-2,420, among others.
The broad stock market broke below its two-month-long trading range recently, as the S&P 500 index fell below the level of 2,600. Then the market accelerated lower and it broke below the level of 2,400 on Monday. The downward correction reached 20% from the September all-time high, surpassing January-February correction of around 12%. Is this a long-term bear market? It still looks like a medium-term downward correction, but the index is now way below the recent consolidation, as we can see on the daily chart:
Negative Expectations, Just Short-Term Downward Correction?
The index futures contracts trade between 1.5-1.6% below their Wednesday's closing prices. So expectations before the opening of today's trading session are negative. The European stock market indexes have lost 0.2-1.7% so far. Investors will wait for some economic data announcements today: Initial Claims at 8:30 a.m., Consumer Confidence number at 10:00 a.m. The broad stock market may fluctuate following its yesterday's rally. It will likely retrace some of the advance at the opening of today's trading session, but then we may see attempts at getting back higher. For now, it looks like an upward correction within a downtrend.
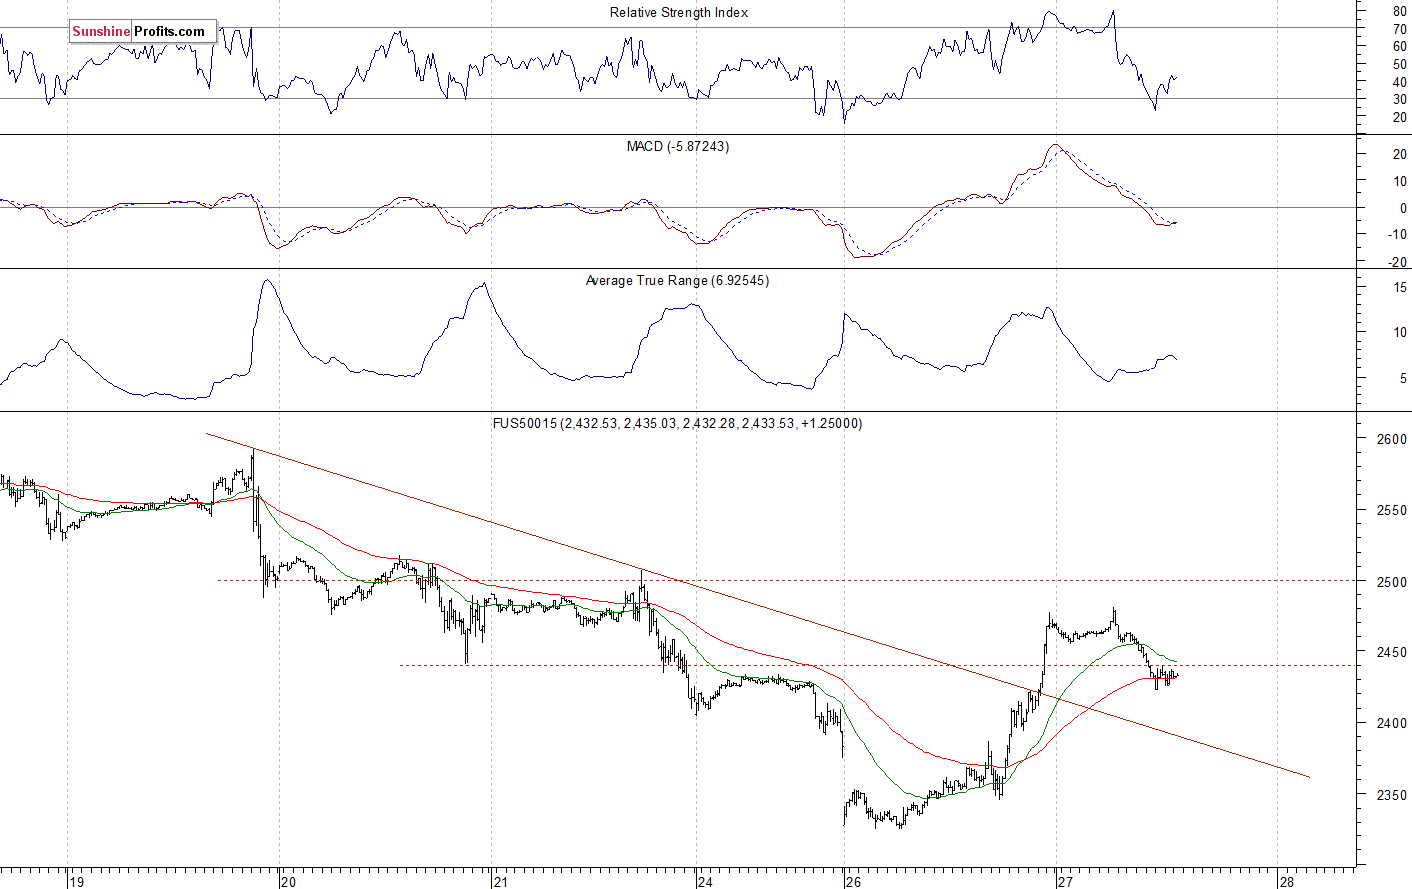
The S&P 500 futures contract trades within an intraday downtrend, as it retraces some of its yesterday's advance. The market remains below the level of 2,500. It bounced off the support level of around 2,300-2,350 yesterday. The nearest important level of resistance is now at 2,480-2,500. On the other hand, the support level is at 2,400, among others. The futures contract got back to its late last week's consolidation, as the 15-minute chart shows:
Nasdaq Also Lower
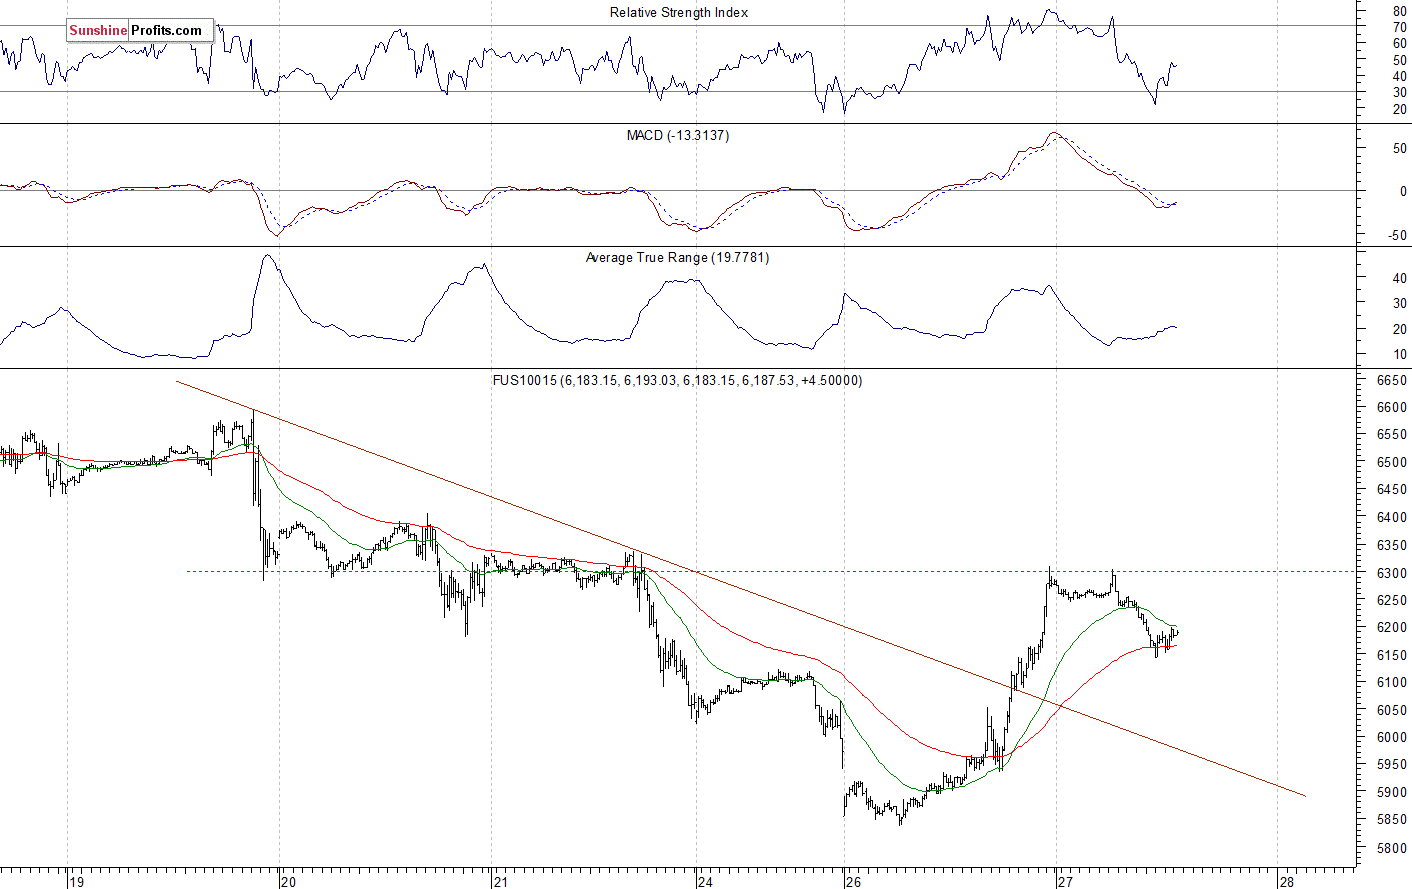
The technology Nasdaq 100 futures contract follows a similar path, as it trades within an intraday downtrend. The market fell below the level of 6,000 on Monday and it continued lower on Wednesday. It traded 24.7% below the early October record high, before reversing higher. The nearest important level of resistance is now at around 6,300. On the other hand, the support level is at 6,100, among others. The Nasdaq futures contract retraces some of its yesterday's rally, as we can see on the 15-minute chart:
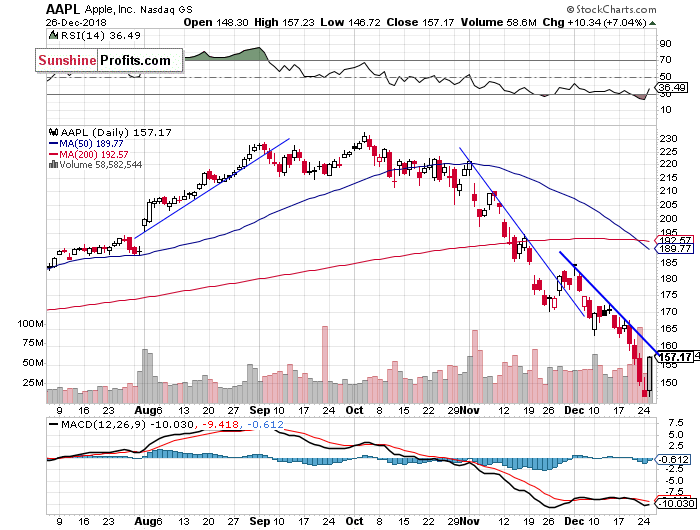
Apple, Amazon - Reversals or Just Corrections?
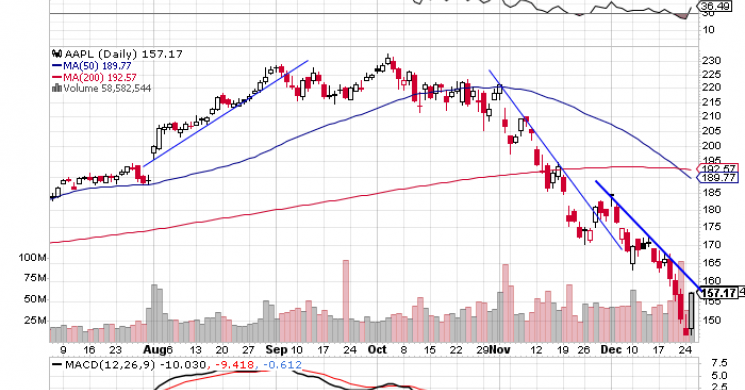
Let's take a look at Apple, Inc. stock (AAPL) daily chart (chart courtesy of http://stockcharts.com). The stock further accelerated its sell-off this week, as it fell below the price of $150. The market reached the new medium-term low of $146.59 on Monday. Then it retraced some of the decline yesterday. However, the stock remains below its month-long downward trend line:
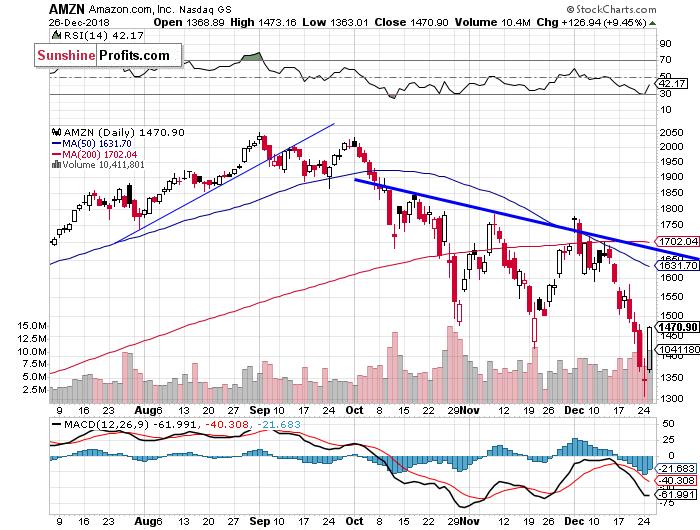
Now let's take a look at Amazon.com, Inc. stock (AMZN) daily chart. The stock accelerated its downtrend recently and it reached the new medium-term low of $1,307 on Monday. Was yesterday's rally the upward reversal? For now, it looks like another upward correction. The market remains below its three-month-long downward trend line:
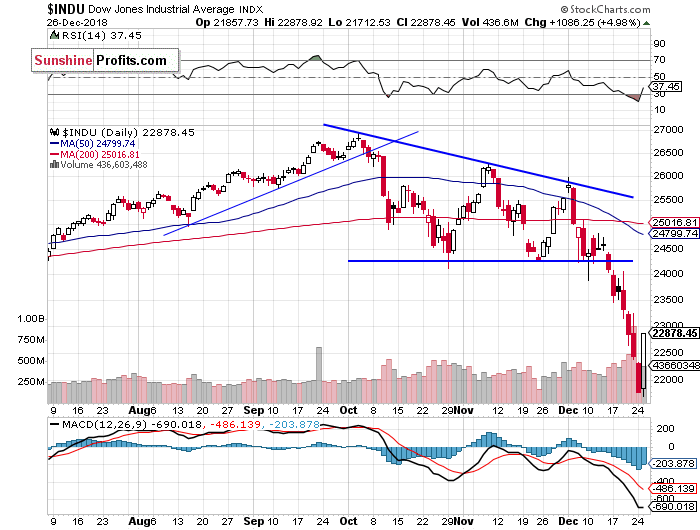
Dow Jones Closer to 23,000 Mark Again
The Dow Jones Industrial Average broke below its two-month-long consolidation in the middle of the month and then it accelerated much lower. The blue-chip stocks' gauge fell below the level of 22,000 on Monday. It slightly extended the downtrend on Wednesday, before sharply reversing higher and getting closer to 23,000 mark. So was it an upward reversal or just a correction within a downtrend? There have been no confirmed medium-term positive signals so far:
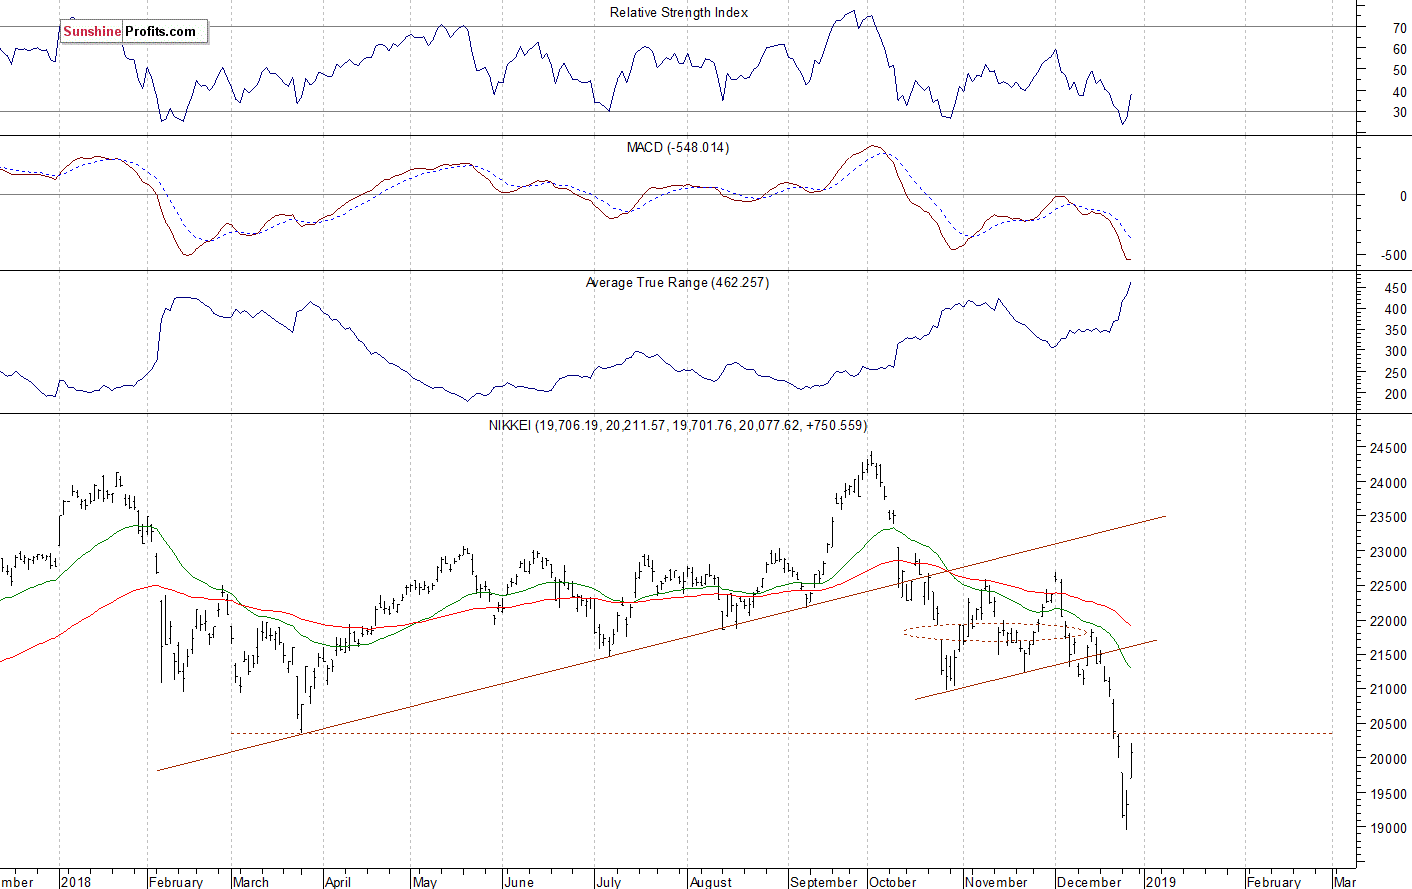
Japanese Nikkei Bouncing Above 20,000
Let's take a look at the Japanese Nikkei 225 index. It accelerated the downtrend this week, as it fell below 19,000 mark on Wednesday. Earlier the market broke below the two-month-long bear flag pattern. The nearest important level of resistance is now at around 20,350, marked by the recent support level:
The S&P 500 index extended its downtrend on Wednesday, before reversing higher and gaining 5%. The broad stock market was more than 20% below its September's record high. Is this a new long-term bear market or just a medium-term downward correction? For now, it looks like a correction. However, there have been no confirmed medium-term positive signals so far.
Concluding, the S&P 500 index will likely open lower today. We may see some more short-term volatility after Monday's panic-selling climax followed by yesterday's rally. If you enjoyed the above analysis and would like to receive free follow-ups, we encourage you to sign up for our daily newsletter – it’s free and if you don’t like it, you can unsubscribe with just 2 clicks. If you sign up today, you’ll also get 7 days of free access to our premium daily Gold & Silver Trading Alerts. Sign up today!
Thank you.
Paul Rejczak Stock Trading Strategist Stock Trading Alerts Sunshine Profits - Free Stock Market Analysis
Read more by MarketSlant Editor


