The world is familiar with FANG (Facebook, Amazon, Netflix, and Google), then came FAANG, Facebook, Amazon, Apple, Netflix, and Google. But are you familiar with BANNG? We would like to introduce to the world a countercyclical group of stocks that could be the biggest winners if FAANGs lose. BANNG = Barrick Gold, Agnico Eagle, Newmont Mining, Newcrest Mining, and Goldcorp. They are the collection of gold stocks that would appear in all the major gold stocks ETFs, major indices in their respective countries. They have the liquidity, market cap, dividends, along with being the group of some of the largest gold miners in the world. Barrick and Newmont are the largest gold miners in the world. Both FAANG and BANNG stocks are in a global equity fund managers MSCI ACWI Index (All Country World Index). But how in love are these global fund managers with FAANGs, and how despised are they with BANNGs? This is the first-time investors can see how underweight Global Equity Funds are in gold's BANNG's stocks.
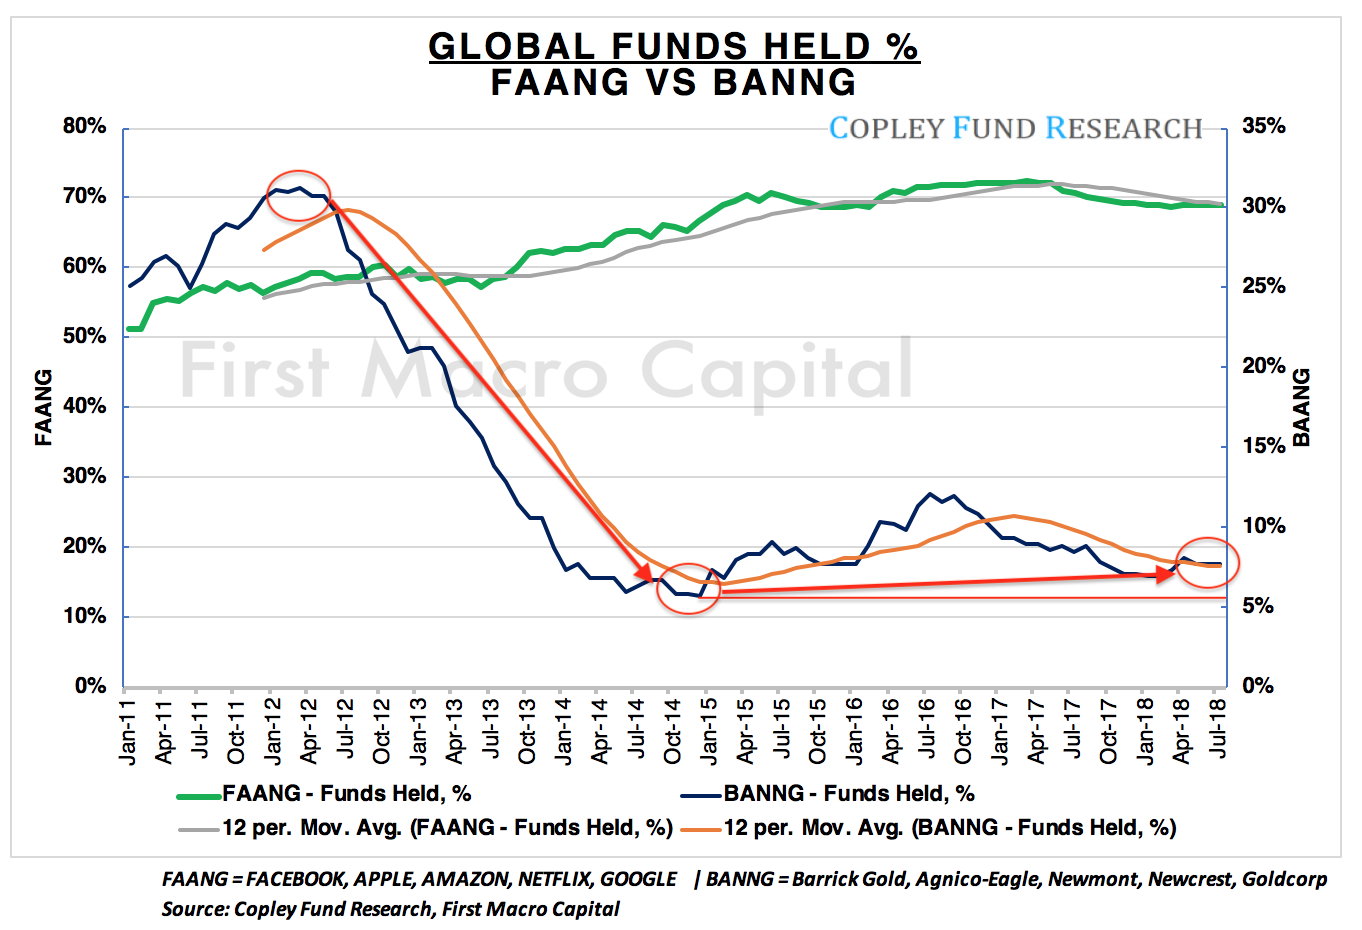
How Many Global Equity Funds Hold FAANGs & BANNGs?
When looking at the 270 Global Equity Funds, with ~480 billion in AUM, we have seen the number of funds owning FAANG's risen from 1 in 2 (51.4%) to 7 in 10, but the number of funds holding FAANG's has been drifting down since April 2017, when it was 72.38%, but not by much to 69% at the end of July 2018. They have been clearly selling into the rally as retail investors continue to hold on.
"Global equity funds have been selling in to strength this year, building a larger underweight in FAANG and tech related stocks. Some of that selling has been reallocated in to Materials stocks but the gulf in ownership is still huge, this has further to go." Steve Holden, Founder at Copley Fund Research
This is in contrast to BANNGs today, where only 1 in 13 (7.7%) global equity fund managers have any exposure to the BANNG group. 1 in 3 funds held the BANNG's during gold's peak in 2011 and even held them well after gold peaked, 31.1% of global equity fund managers peaked in January 2012. The number of global fund managers didn't start to reduce exposure until the second quarter of 2012, and more meaningful in the second half of 2012. This is almost one year after the gold price peaked.
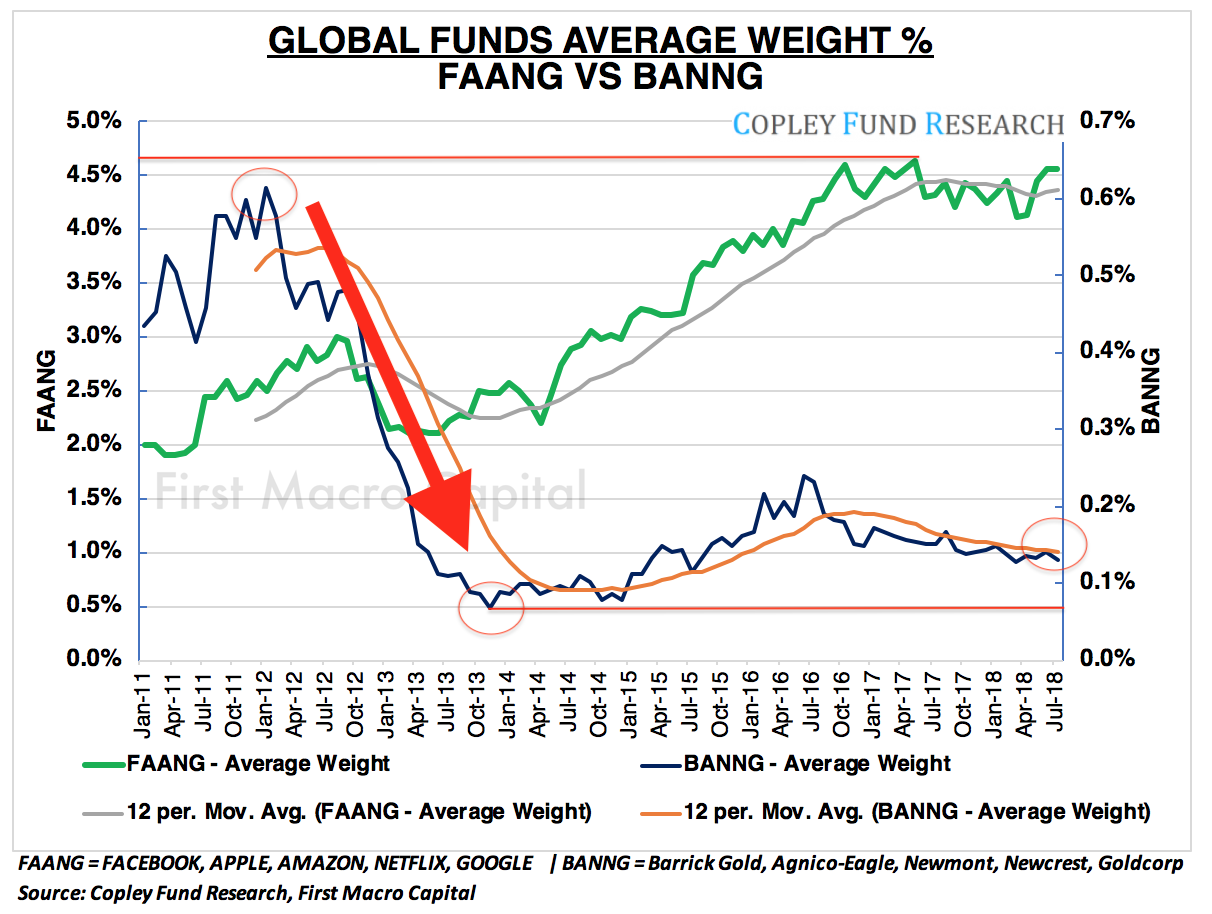
How Much Exposure Do Global Equity Funds Have to FAAANGs & BAANGs?
When we look at the funds with a global mandate, the average weight to the basket of FAANG's has more than doubled from 2.0% to 4.6% since April 2011. But fund managers have held the line in keeping their FAANG exposure to no more than 4.5%. This is in contrast to BANNG's that saw their exposure in global mandate funds fall by more than 90%, from a high of 0.61% to 0.068% at the low in 2013, and currently at 0.13%. Let's repeat that, Global equity fund managers only have an average weight of 0.13% allocation across ALL BANNGs. This presents a huge untapped opportunity for investors. Global Funds missed the runup in the gold price in the first half of 2018, as fund exposure continues to fall.
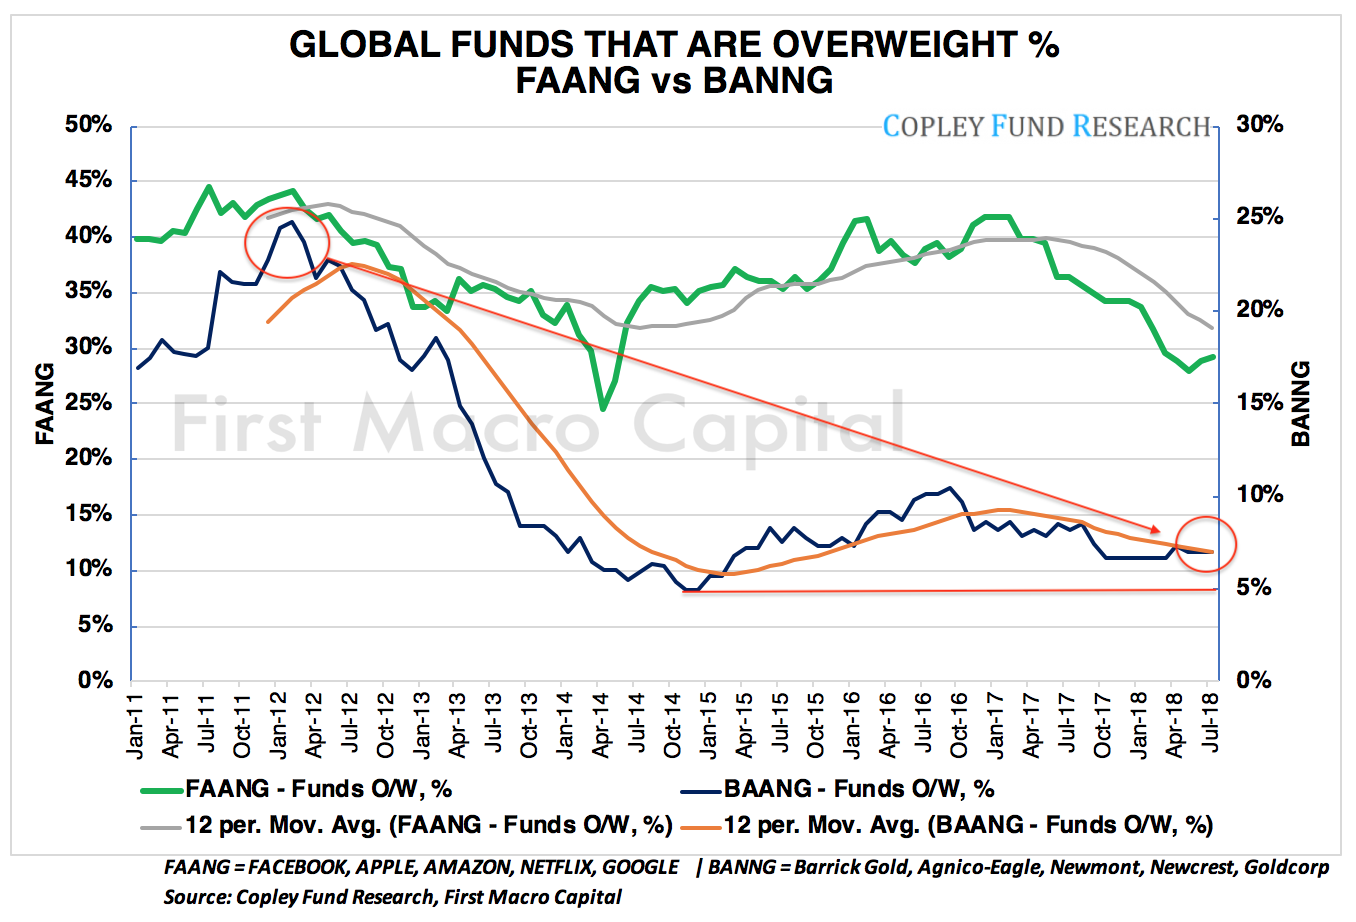
How Many Funds Are Overweight FAANG's & BANNG's?
With all that exposure by global equity managers, only 29.2% of global equity funds were overweight FAANGs, down from a high in 2011, when more than 44.4% of global equity fund managers were overweight FAANGs, relative to the MSCI All-Country World Index. Interestingly, 7% of the global fund managers were overweight the BANNG STOCKS, down from a peak of 24.9% in February 2012.
OPPORTUNITIES FROM CAPITAL FLIGHT & SECTOR SHIFT
We are already seeing a sector rotation out of technology as defensives are outperforming Tech and Consumer Discretionary over the past 11 months and particularly the pain has been in tech over the six months:
"1m returns after said "trigger" shows SPX -0.4%, with "Defensives" Utes / Staples / Telcos outperforming Tech and Cons Discretionary" (Nomura)
"6m returns evidence the worst potential pain-trade of them all: best performing sectors are Fins / Utes / Healthcare / Telco / Energy, with Tech as worst- performing sector" (Nomua)
The Newmont Edge
If capital continues to flow into the US, Newmont Mining has an edge over the other BANNGs, because it is the only company that is in the S&P 500. No other BANNG will be able to do this unless they change to being domiciled to the U.S.
Over at Barrick, Executive Chairman John Thornton is taking a non-traditional approach to the gold sector, focusing on profits over production ounces. He is taking his non-mining background and focusing on creating a consistently profitable business, with the aim that many of the diversified miners have done. Mr. Thornton doesn't have to follow the standard norms or practices as to what has been in the past, potentially setting up the company to outperform its peers as its taking an unconventional approach. We think its welcomed. "(Thornton) doesn't have the DNA of a mining manager, or a mining family industry executive" (National Post). We would counter, that the one thing counts for shareholders, and that is delivering shareholder performance over anything else. If he is able to deliver on earnings, the share price will follow.
SUMMARY
The contrarian view over the next 2-3 years puts the odds in favor of BANNG's outperforming FAANGs, as FAANGs come under political pressure, typically highlighting the end of a sector run. Global Equity Fund Managers are light on BANNG's, so those positioned with a view over a 2-3 year time horizon, will be able to capitalize on fund flows back into the sector. While governments are opening up to miners to expand in their countries to create jobs as we have seen in Canada, Brazil, and the United States. The Risk-Reward for fund managers presents an opportunity shift from FAANGs to BANNGs with better asymmetric opportunities. We think this is the beginning of BANNGs versus FAANGs as we see a sector rotation into materials and FAANGs comes under political pressure, a common occurrence at the end of a sector cycle.
Paul Farrugia, BCom. Paul is the President & CEO of First Macro Capital. He helps his readers identify mining stocks to hold for the long-term. He provides a checklist to find winning gold and silver mining producer stocks, including battery metals. Data powered by Copley Fund Research.
Read more by First Macro Capital


