Today is the day that most of the world, and certainly all investors/traders, are watching as the US mid-term elections play out. The news channels and just about everyone is talking about how the results of these elections will potentially change or alter the US and global economies. Many are prognosticating that a solid red or blue result will drive investor sentiment and capital shifts for many months – which is correct.
Capital is very fluid and actively hunts for the safest and best returns. Over the past two+ years, our researchers, at www.TheTechnicalTraders.com, have authored countless articles highlighting our belief that a massive capital shift was taking place where global cash was rushing into the US markets after the 2016 Presidential election in an effort to ride the increased share price valuations and a safe-harbor element provided by US equities. This current election may change this perception a bit based on the final outcome of the elections, but we continue to believe the US equities markets and economy will continue to drive renewed growth and opportunity for at least 3~4 more years.
We, certainly, believe that valuations within certain sectors may become a concern over the next 24 months or so. Yet, we don't believe the continue capital shift where cash has been rushing into the US markets and supporting the US Dollar is going to change dramatically with this current election cycle. We believe the US economy is firing on nearly all cylinders right now and it would take a massive blow to the political, economic and geopolitical landscape to unravel the US economy as it sits currently.
If you've been following our research posts, you already know that we called a market bottom near October 15th – yes, a bit early – we get it. Our proprietary indicators did not foresee the Fed/housing data news that resulted in the extended pricing pressure, lower, to the ultimate lows near October 25th. Yet, with October behind us and the US mid-term elections playing out, we are certain many of you want to know what we see in the future for the markets. So, here we go...
The reality is that our analysis has not changed much since we posted, on Sept 17th, our warning that the US stock market would likely experience a 5~8% price correction on or after September 21 and find an ultimate price bottom near November 8~12th before beginning a new upside price rally. These predictions were made nearly 60 days ago and our analysis has been quite accurate since we made our predictions (yes, we know we missed the extended downside move near October 25). When you consider the fact that we made these predictions using our proprietary price modeling and adaptive learning systems many months ago, one has to ask the question “if they can predict the markets with this type of accuracy, what else can they predict?”
The answer is quite simple, our analysis models and predictive learning systems are capable of identifying high probability price trends and key “price anomaly” structures before they happen – in some cases, many months before price rotates. Right now, the most important aspect of our predictive modeling that we urge all of our readers to understand is that an ultimate price bottom should be set up between Nov 8 and Nov 12. After that time, we expect a new price rally to begin sometime near after Nov 15th. We will continue to alert our followers with new predictive modeling as these key dates/predictions play out.
Now, let's take a look at some charts to highlight what we believe will take place over the next few weeks.
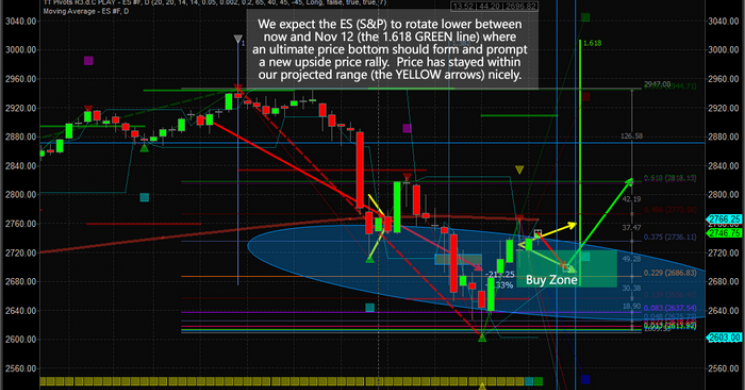
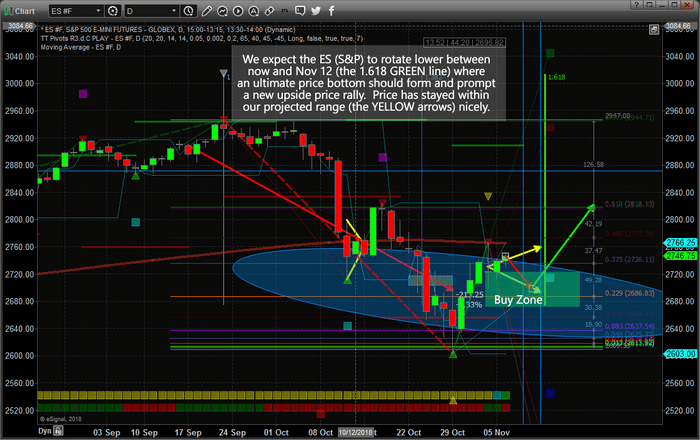
This Daily ES (S&P) chart shows our ongoing research and predictions from the week ending Nov 2 and earlier. At that time, we predicted the future price activity of the ES would stay within the YELLOW ARROWS range headed into the US elections and through our ultimate bottom price date range between Nov 8 and Nov 12. The vertical thin blue lines highlight those two key dates. The heavy GREEN LINE (1.618) reflects a key Fibonacci time/price cycle that is occurring on or near Nov 12. This is a very important indicator that a key price inflection point is likely to drive a massive price rotation near this date. Our expectations are that price will rotate and likely fall into the BUY ZONE over the next 5+ days, setting up a very important opportunity for skilled traders. As we move closer to the Nov 8~12 ultimate bottom date, we expect the price to begin a moderate rally higher and eventually breakout to the upside targeting the 2830~2840 level initially.
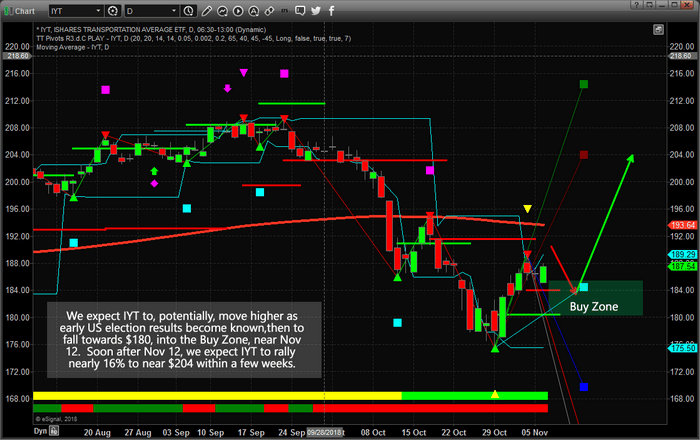
We expect the Transportation Index (IYT) to mimic the ES, to some degree, and present a new opportunity for skilled traders near the BUY ZONE. We believe this rotation will be the result of shifting perspectives and expectations as the election data is released. We've read that the true final outcome of the US mid-term elections may not be known for many weeks after the elections are completed, today. This means we could see an extended period of uncertainty in the US and global markets over the next few weeks. Additionally, we believe the general outcome will become known on or after November 15th. Thus, we believe our predictive modeling systems are accurately suggesting the final outcome of this election cycle will result in a positive outcome for the markets – likely a result of the continued strength of the US economy and the expectations of a Christmas Rally unfolding.
This IYT BUY ZONE presents a very clear opportunity for skilled traders to target a 10~15% upside potential if our predictions play out as expected. Get ready for some great trades to set up over the next 5+ months.
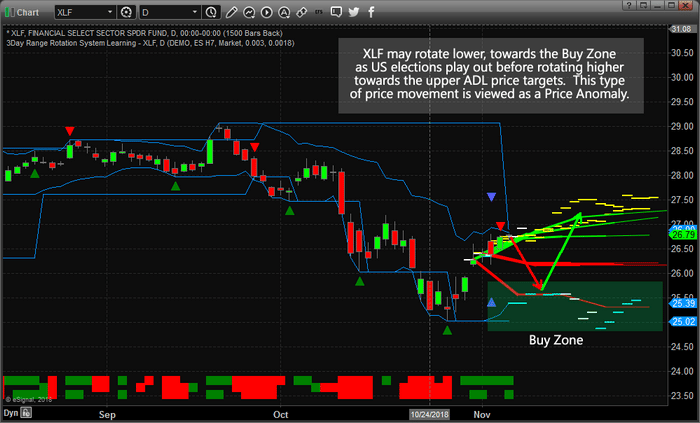
Saving the best for last, this XLF Daily chart (financials) highlights our Adaptive Dynamic Learning (ADL) predictive price modeling system at work. The interesting thing about this predictive modeling tool is that it can show us where we should expect the price to go well out into the future, but it can also highlight what we call “Price Anomalies” where price MAY rotate in a way that is counter to our predictive models. When this happens, we consider it an Anomaly where price is moving against predictive norms and, thus, is likely to and may “revert” back to the predicted price levels.
In the XLF example, below, you can see one of our predictive models suggested prices may move in a lower price range than the other predictive models. This is an “anomaly price range” and the way we interpret it is “if price does rotate lower, near the lower ADL price targets, then this sets up a potential for a very good Reversion Trade where price will attempt to move back towards the higher ADL prices” - roughly +5 to +8% or more. Therefore, if the price of the XLF falls below the GAP high, on Oct 30, of $25.94, we believe this sets up a very high probability “reversion trade” for a move back to near $26.90 or higher.
By this time, you should be seeing a common theme within our analysis. If you were paying attention, you will notice that we are suggesting the US equity markets will likely rotate a bit lower over the next 5+ days before finding and setting up for our predicted “ultimate price bottom” near November 8~12. These predictions allow for skilled traders to set up and position their portfolios for some incredible opportunities headed into the end of 2018.
We believe the outcome of the US mid-term elections may change some perspective of the economy and expectations a bit, but overall the US economy will continue to push along and drive greater expectations of capital growth and improving outcomes. Our opinion is that a massive price, and potentially global price destructive event, would have to take place to derail the current capital shift that is taking place throughout the planet. This current capital shift will not last forever, nor should we expect it to continue as it has for the past 24+ months at the same, or similar, levels. Yet, as of right now, we believe the outcome of the US mid-term elections will not dramatically alter the future pricing and valuation predictions of the US stock market going forward for at least 5+ months.
In closing, if you value the research, analysis and trading signals we share with you, as well as the effort we take to make sure you are keenly aware of our expectations and pricing models, then do yourself and our research team an favor and visit www.TheTechnicalTraders.com and consider subscribing to our services as a member. Our followers and members have commented that we are “the only team that can accurately predict prices and price rotation many months into the future” and we believe our proprietary predictive modeling tools are the best on the planet. If you like our research and have profited from our efforts to help you find and execute better trades, then please consider supporting our work by visiting www.TheTechnicalTraders.com. Get ready to make 2019 a fantastic year with great trades.
Chris Vermeulen
Read more by TheTechTrader


