I keep thinking, 'here we go again', It is worth remembering this tome, A new all time highs in stocks, do not equal future prosperity! In a few short years time, you will ask yourself this question. " How could we not see it coming? "
Sit up and take notice.... There has never been a period in history like this one. When the financial markets were so precariously positioned - The Cyclically adjusted PE (cape) has never been higher in history!
When the populace in general has been so financially stretched - the average person has less than 1 months salary in savings!
When the central governments of the western world were so indebted in peace time - Not one western country is running a budget surplus and none are prepared for adversity!
Times like these require one reaction from us, preparedness. Prepare for at least a 60% market correction in the near future and the chaos this will bring. prepare to lose your job if your company goes under. prepare your savings before it happens, not during. And then sit back and prepare to capitalize on the opportunity when the time is right. There will be an opportunity to create generational wealth when this next market half cycle is over. Prepare to be that one eyed man, in the land of the blind!
DOW JONES INDUSTRIALS
30 min
4 Hours
Daily

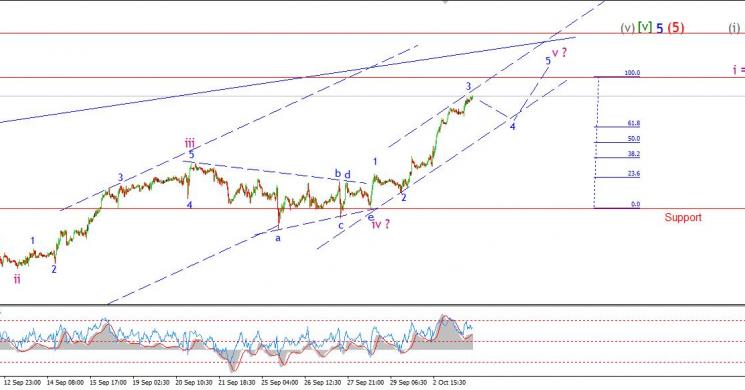
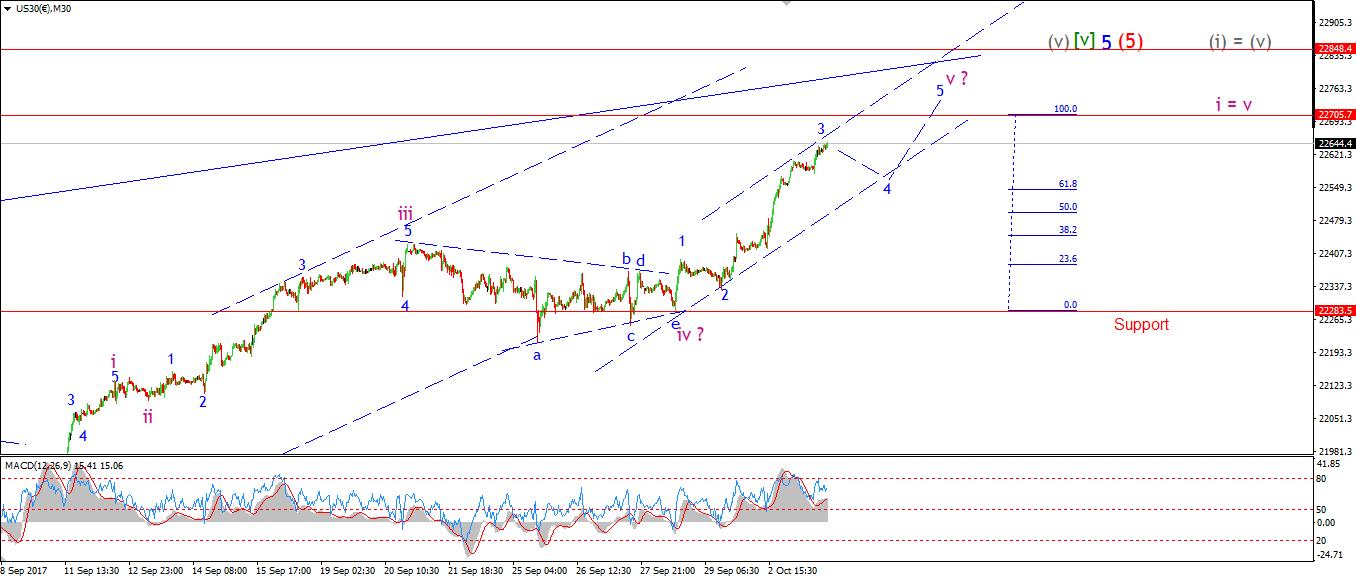
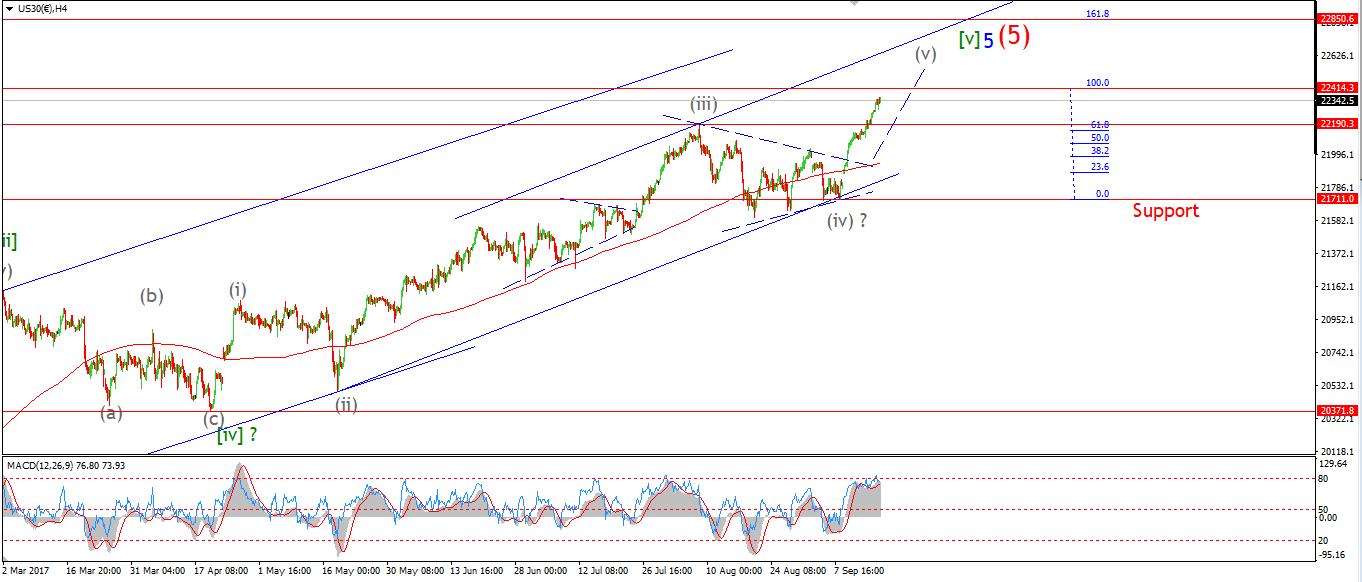
My Bias: market topping process ongoing Wave Structure: Impulsive 5 wave structure, possibly topping in an all time high. Long term wave count: Possibly topping in wave (5)
Stocks continue to levitate in a breathtaking display today. This is an historically notable example of how disconnected the financial market can be from underlying economic fundamentals. People are buying because people are buying, that is the rationale right now. This will works for a short while, but the pain is coming. Have no doubt.
It looks as if an extended wave '3' blue is now complete at todays highs. The price should cool off tomorrow in wave '4' blue. wave '5' blue should reach the initial target at 22705 at a minimum.
Tomorrow; Watch for wave '4' blue to take hold. A decline into 22550 and a touch of the lower trend channel would fit the picture well.
GOLD
30 min
4 Hours
Daily
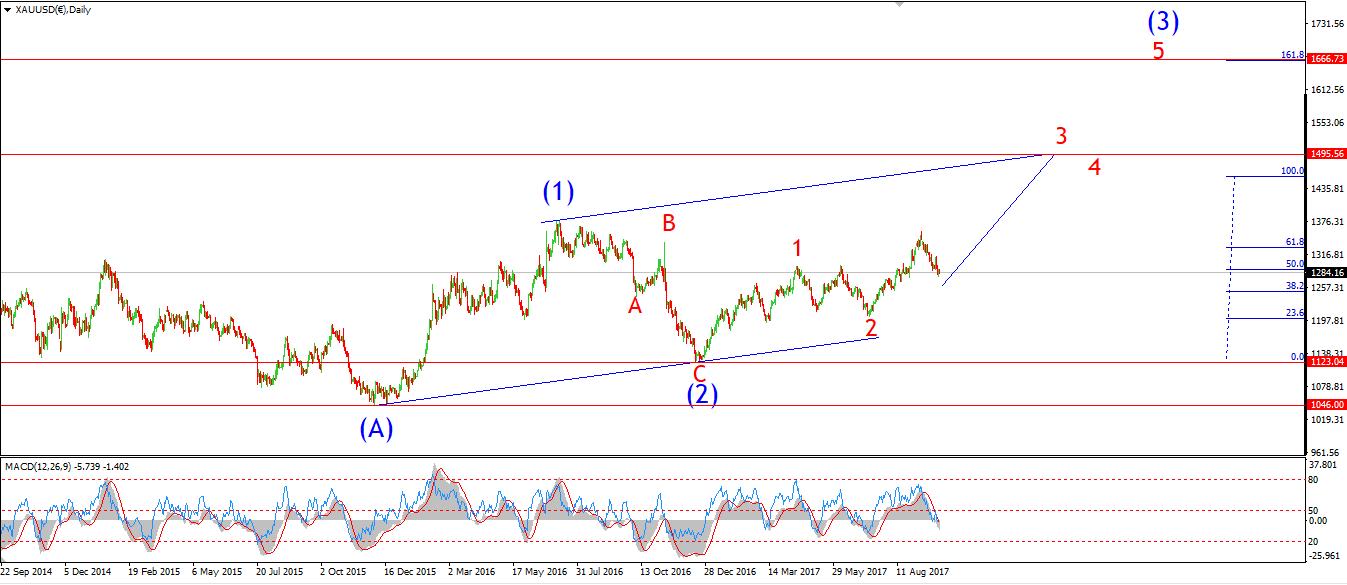
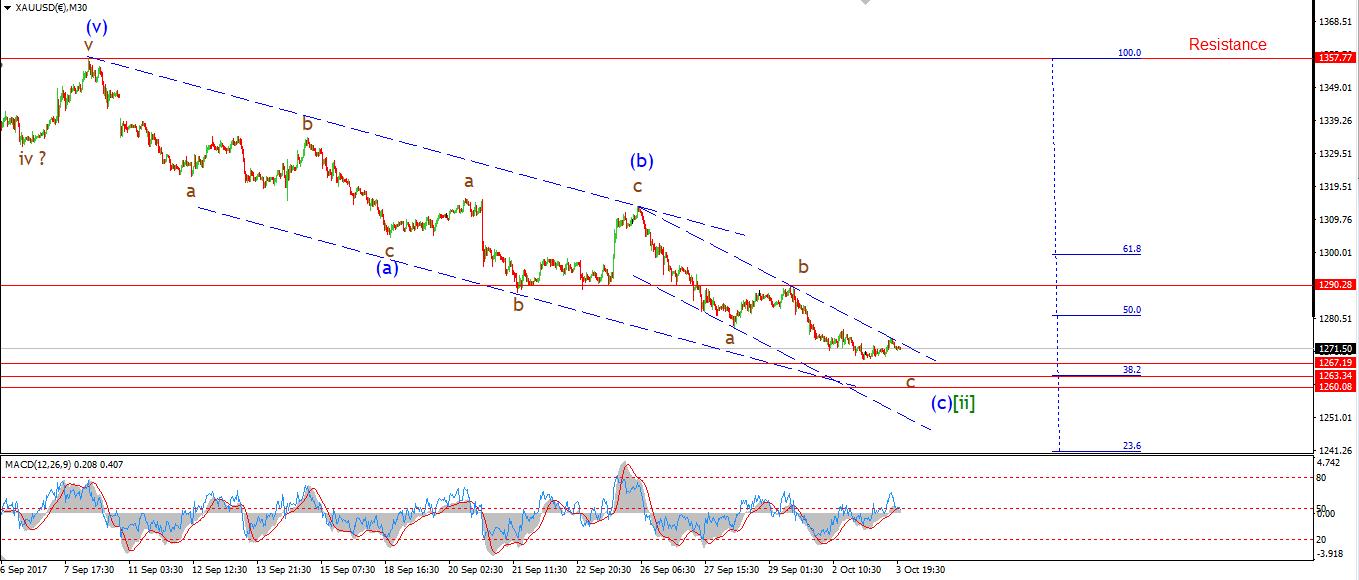
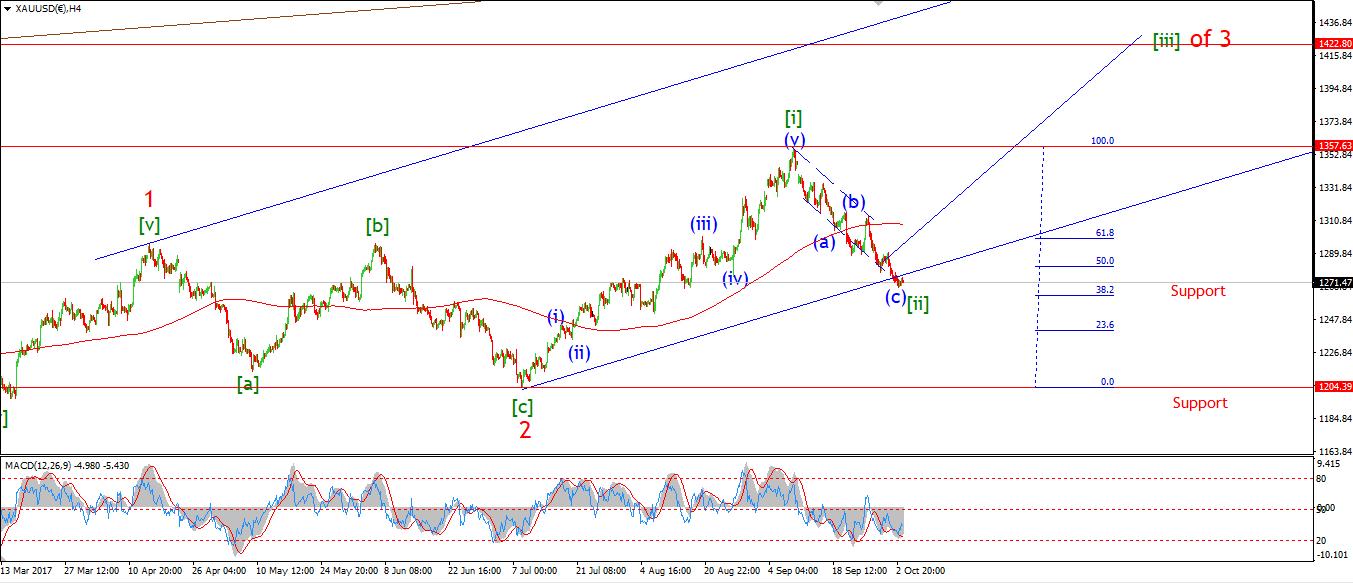
My Bias: Long to a new all time high above 1827. Wave Structure: Impulse structure to a new high. Long term wave count: wave (3) above 1666.
GOLD is now showing signs of a momentum turn at both the 30min and 4hr chart resolutions. The price has so far failed to break below support at 1267. But we have not seen any impulsive spike higher off the recent low yet either.
The wave count suggests that this is but a matter of days away. The price should begin an initial push up towards 1290 and create a higher low before the week is out.
Tomorrows focus is on a swing to the upside off support. A break of resistance at 1290 will signal that the price has likely turned up again in wave [iii] green.
U.S CRUDE OIL
30 min
4 Hours
Daily
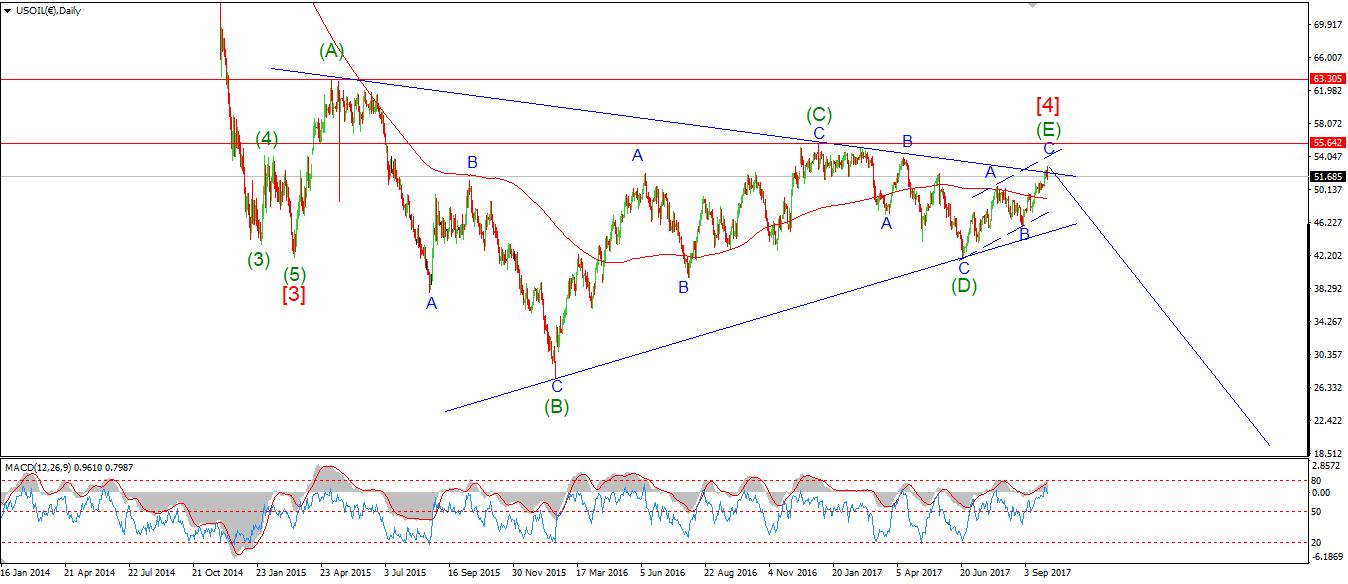
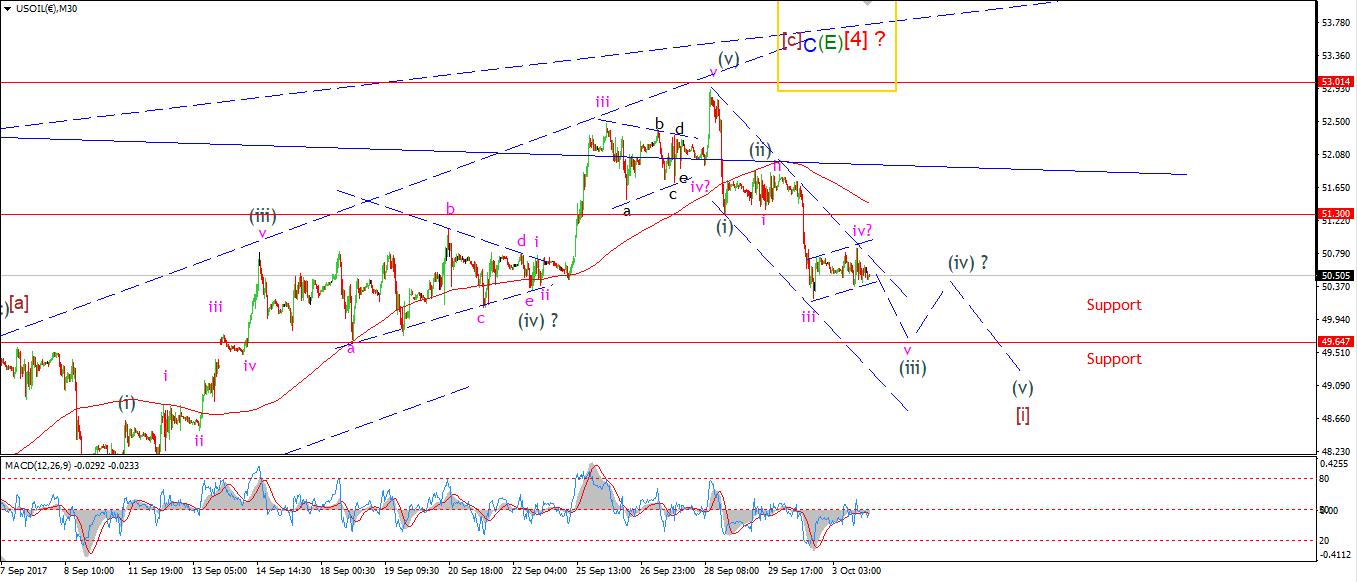
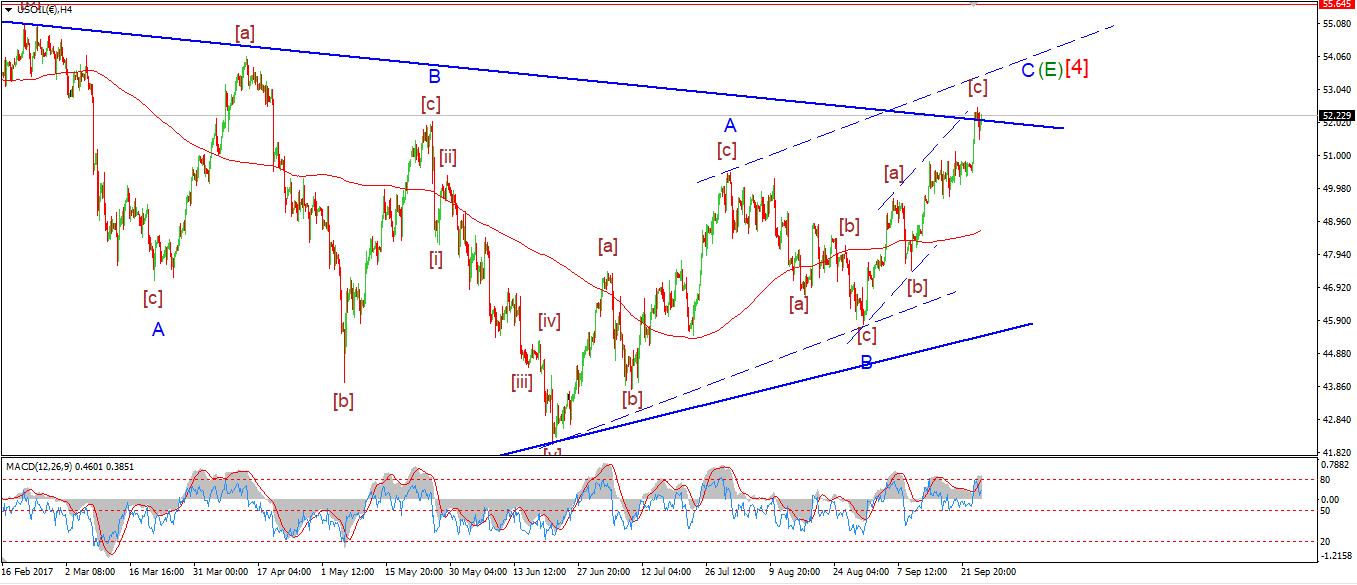
My Bias: topping in a large correction wave [4]. Wave Structure: ZigZag correction to the downside. Long term wave count: Declining in wave 'c' target, below $20
Crude has possible completed its correction in wave 'iv' pink at todays high of 50.73. The price reached the trend channel and turned down immediately.
a break of 50.07, the wave 'iii' low, will signal that wave 'v' is underway.
On the 4hr chart, The RSI and MACD have both completed a bearish centreline cross, And the price is approaching the 200MA rapidly. A break of the 200MA will be another bearish signal to add to the list already on display.
For tomorrow; Watch for a further decline in wave 'v' pink to complete the larger wave (iii) grey.
Read more by Enda Glynn


