We admit being big fans of Elliot Wave. We must also admit its subjectivity is difficult for us to manage. But here is a person who manages their own subjectivity and keeps the info dry and honest. Therefore we are followers of Enda and recommend her work for anyone seeking to use while learning the rules of this difficult but excellent probabilistic market engine handicapper.
Enda covers many markets. We chose to lead with her Gold content. We hope you read all of it as we do. Also note the USD analysis. Given recent events, this may be quite prescient. - Vince Lanci for the Soren K Group
Via Enda Glynn and BULLWAVES.ORG
GOLD
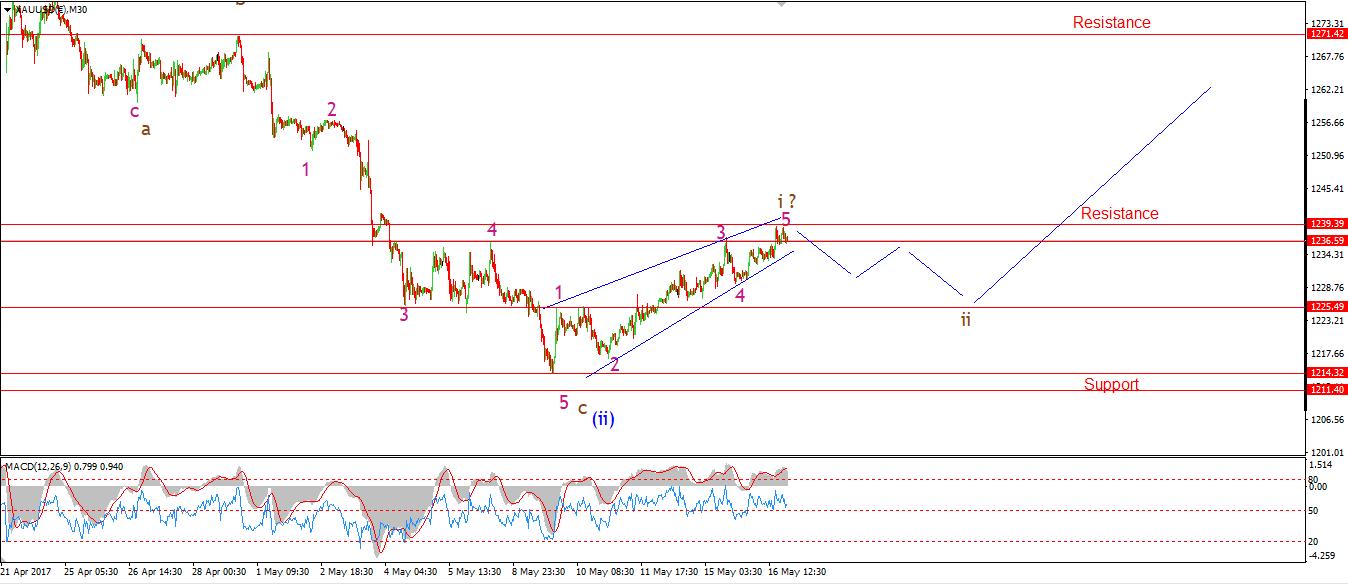
30 min
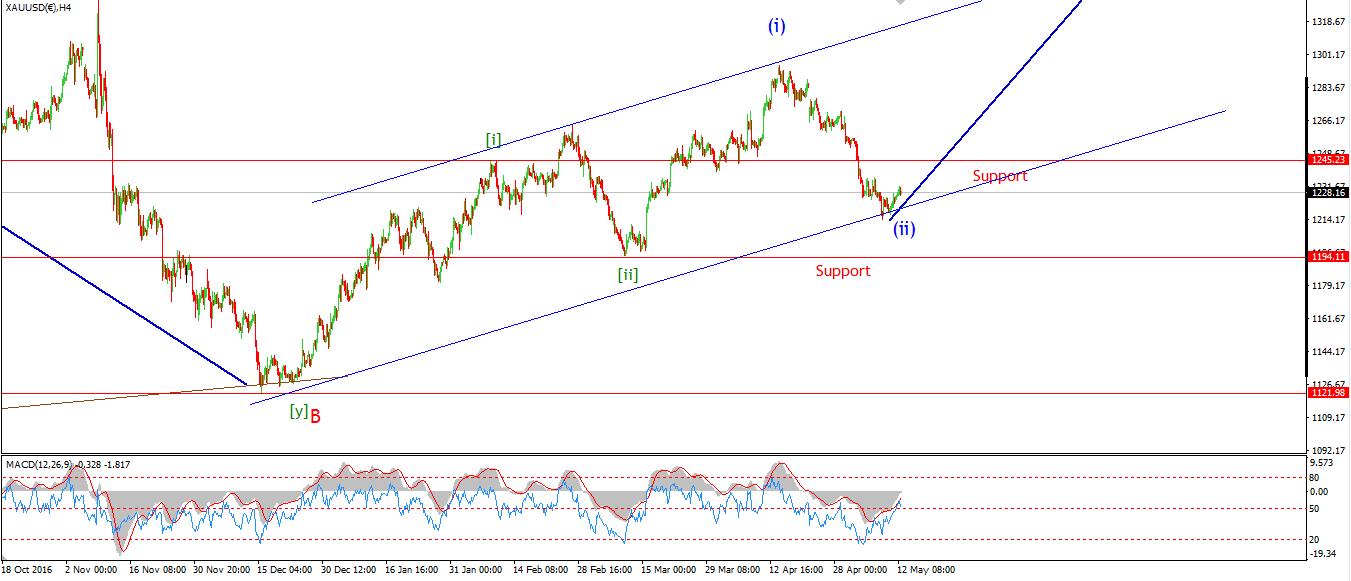
4 Hours
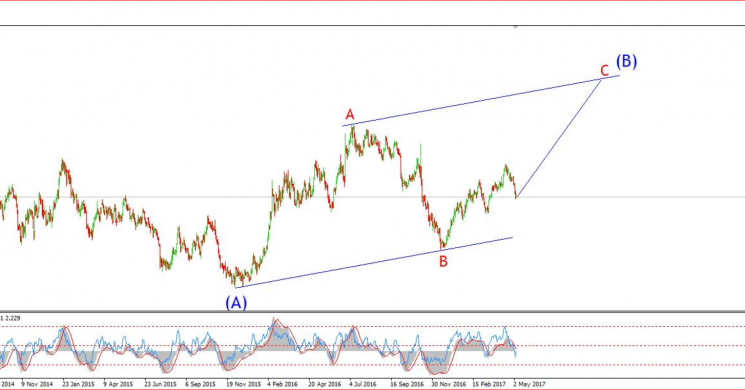
Daily
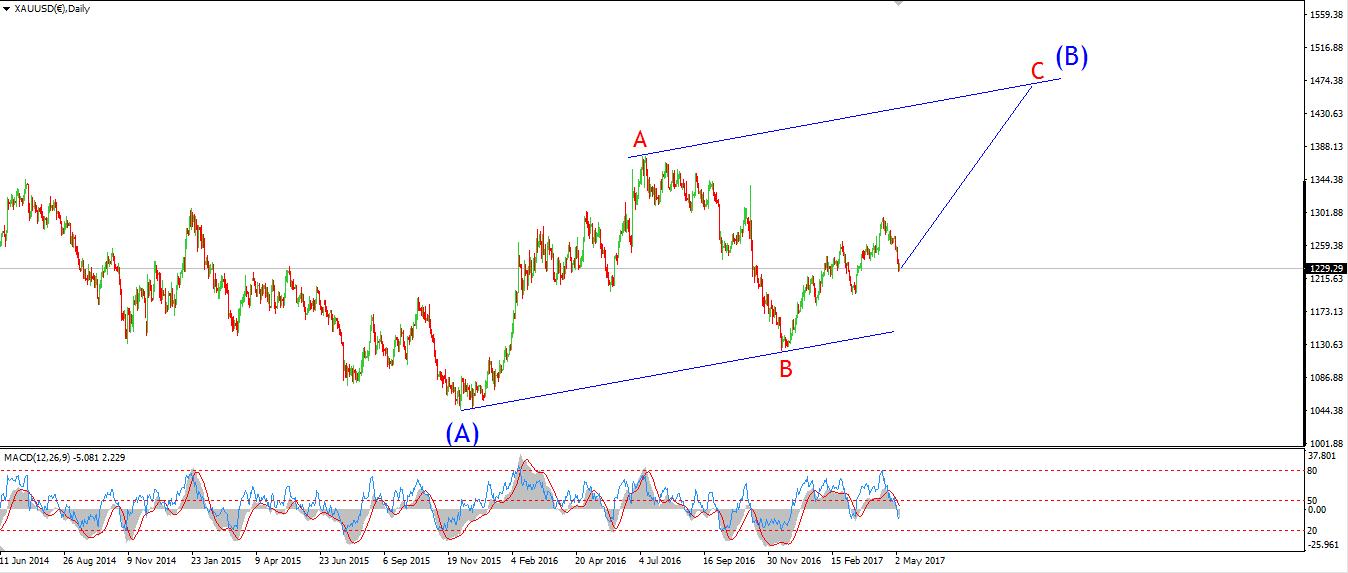
My Bias: Long towards 1550 Wave Structure: ZigZag correction to the upside. Long term wave count: Topping in wave (B) at 1550 Important risk events: USD: Crude Oil Inventories.
The short term count in GOLD has been something of a mystery to me over the last few days. The market is rising as expected off last weeks lows.
BUT! The price action has not yet turned impulsive as thought. So there is still an air of concern in the short term.
That being said, I have labelled the structure as a leading diagonal in wave 'i' brown. The proof of this wave count lies in the action off the highs in wave 'i'. If we get a clear three wave movement which forms a higher low above 1214.24 Then we will have an Elliot wave buy signal in place. Every other aspect of my analysis points to a low at current levels And the extreme in negative sentiment on display at the moment is in itself a sure sign that the price is about to rally. As always, The signs are in place, all we need now is the rally itself!
Daily-Elliott-wave-analysis-05-16-17 EURUSD trigger alternate count - outlook unchanged.
EURUSD
30 min
4 Hours
Daily
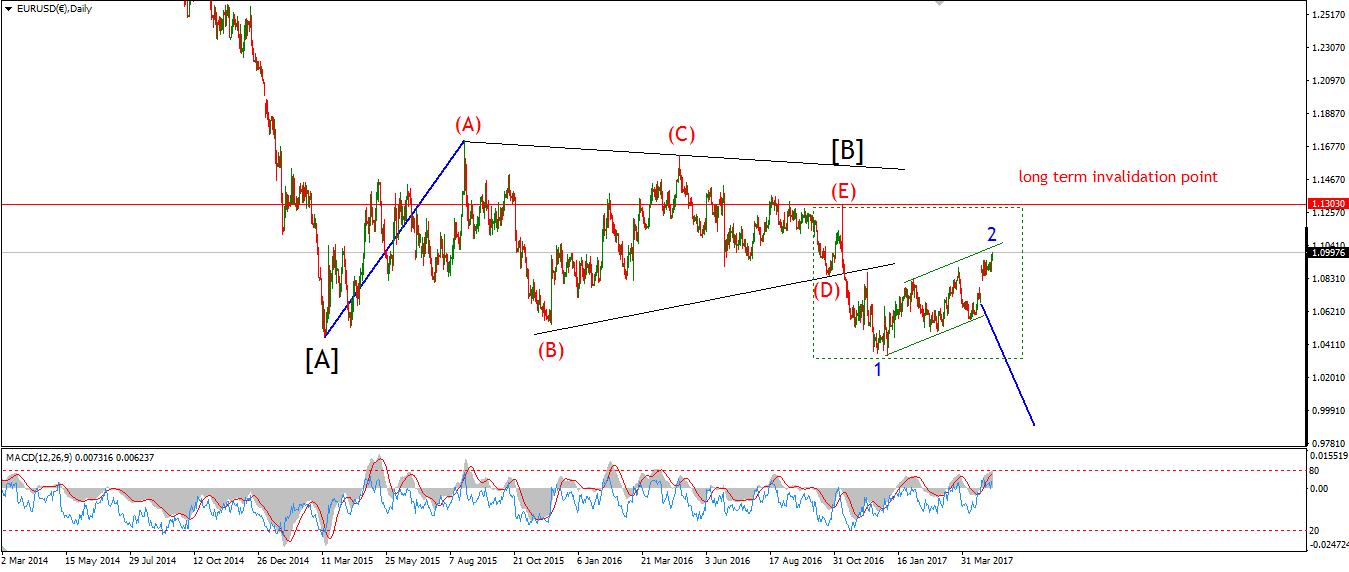
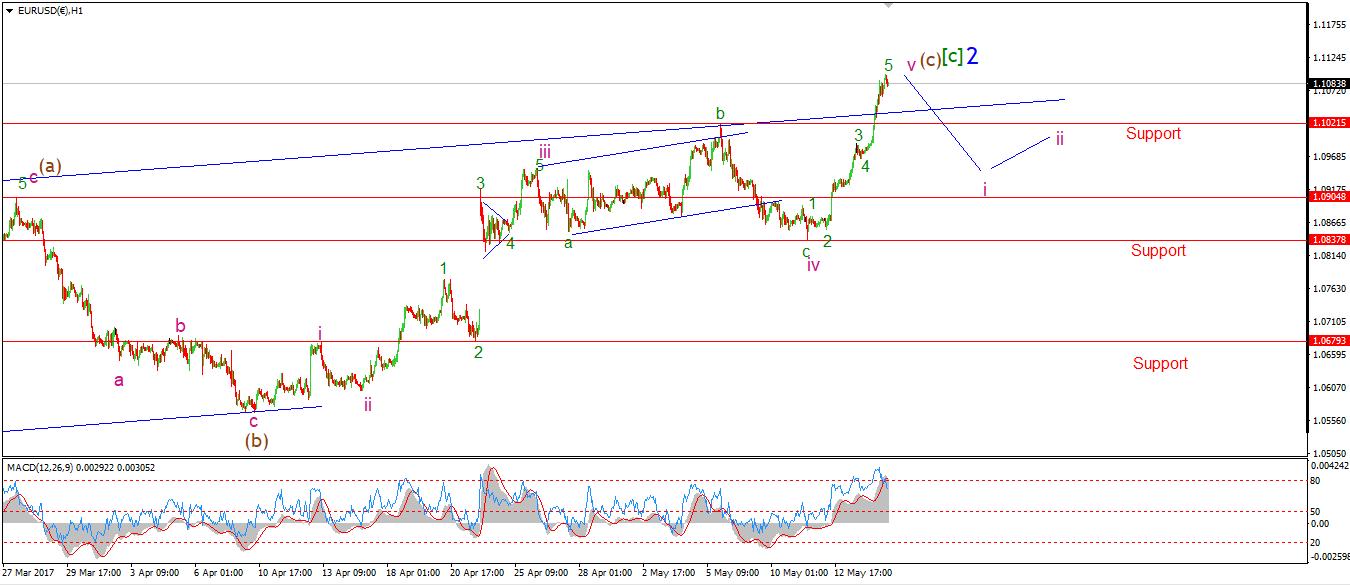
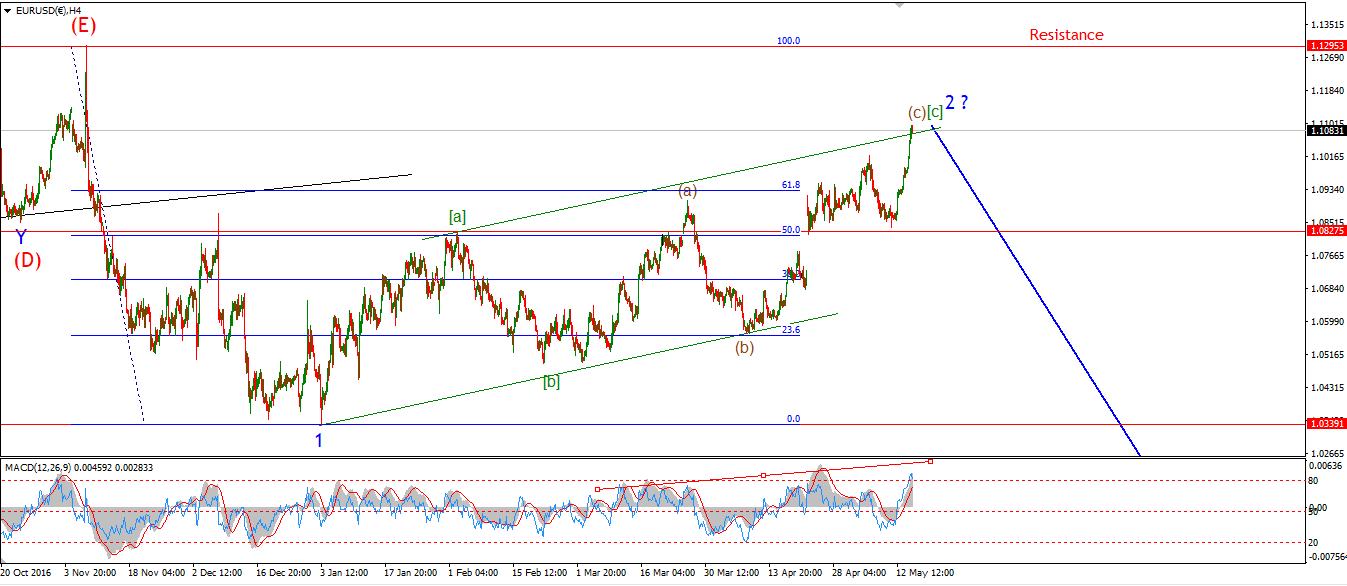
My Bias: short in wave 3 blue. Wave Structure: downward impulse wave 1, 2 blue Long term wave count: lower in wave 3 blue Important risk events: EUR: Final CPI y/y. USD: Crude Oil Inventories.
Evening Everyone!
What a day for EURUSD, I mentioned in last nights analysis the possibility of another push higher to complete the alternate count. Todays rally and break of 1.1021, confirms the alternate view which was simply a variation on the same theme. This market is now extended in a very complex correction higher. Correction being the operative word, this rally will be completely retraced, and sooner rather than later according to this wave count.
You will notice on the chart that wave 'iv' pink has extended out to form an expanded flat correction. Wave 'v' pink can be counted as complete at todays highs. This market is regestering a very overbought extreme right now, with the 4hr RSI posting a six month high today at 86.6! The count in wave '2' blue is complete, All that is left is the price to turn down again back into the long term trend. and of course the world and it mother now wants to buy the Euro! Perfect timing really, I would advise against that course of action right now! the focus again turns to an elliott wave signal off the high.
GBPUSD
30 min
4 Hours
Daily
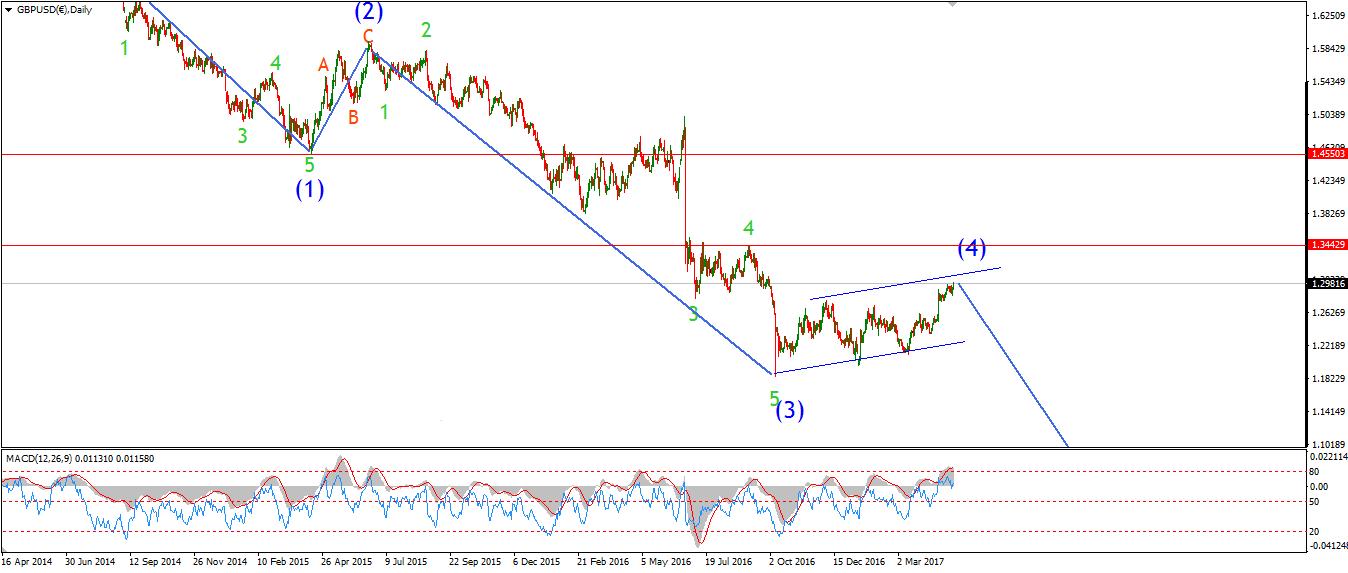
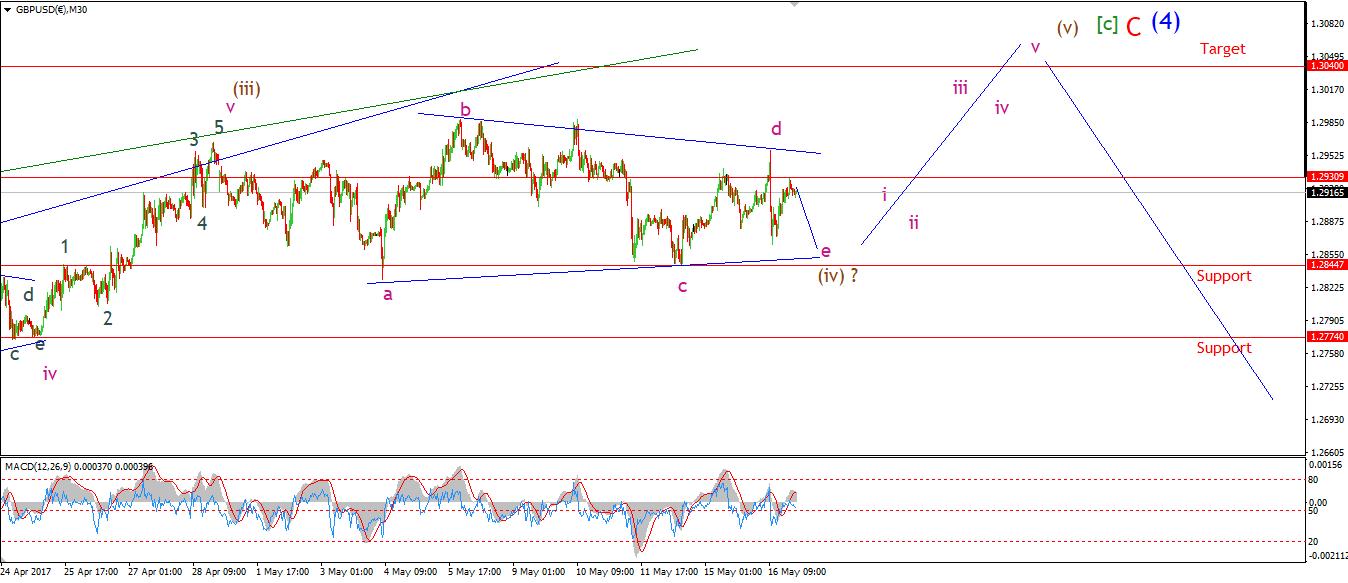
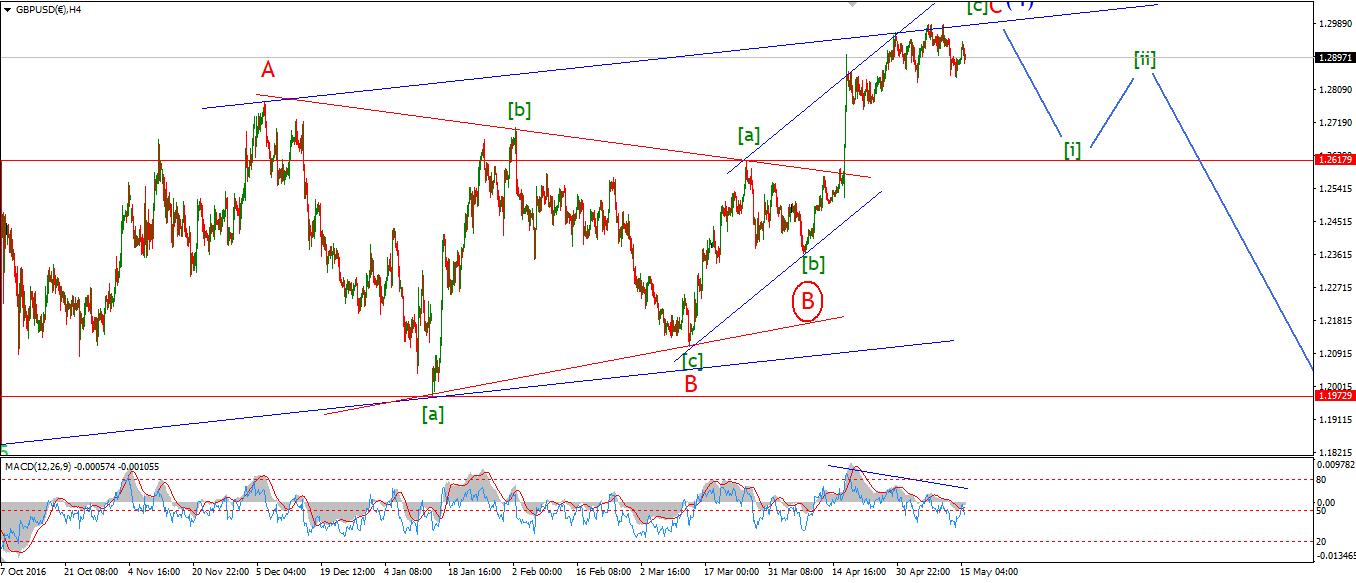
My Bias: short below parity. Wave Structure: continuing impulsive structure to the downside in wave (5) Long term wave count: decline in wave (5) blue, below parity Important risk events: GBP: Average Earnings Index 3m/y, Unemployment Rate. USD: Crude Oil Inventories.
The price action in Cable threw up another possibility today as an option in wave (iv) brown. I have labelled a completing contracting triangle with waves 'a' through 'e' as almost complete.
The low labelled wave 'c' pink is the lower limit for wave 'e' of the triangle to travel. As a break of that low at 1.2844 will rule the triangle pattern out.
todays high lies at 1.2929, and a break of that high will confirm that wave (v) brown is underway. One thing is for sure, The last three weeks of sideways action is coming to an end soon, The wave count calls for another rally higher into the 1.30 area to complete the larger wave pattern. watch for the completion of three waves off the high of wave 'd' in pink.
USDJPY
30 min
4 Hours
Daily
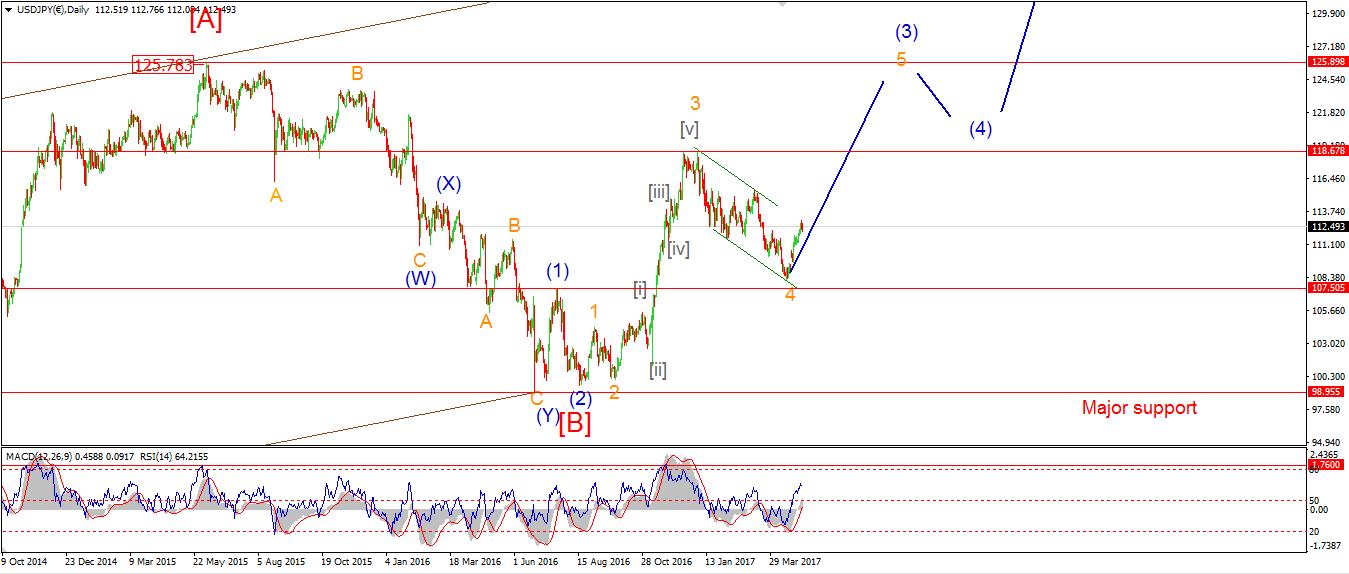
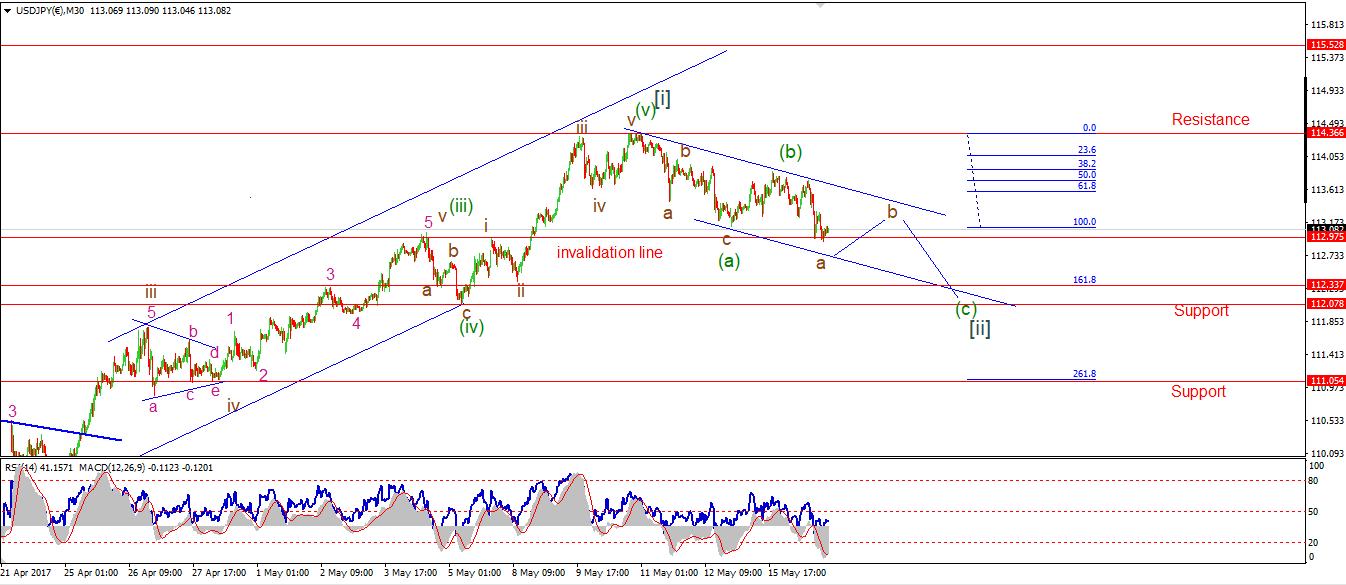
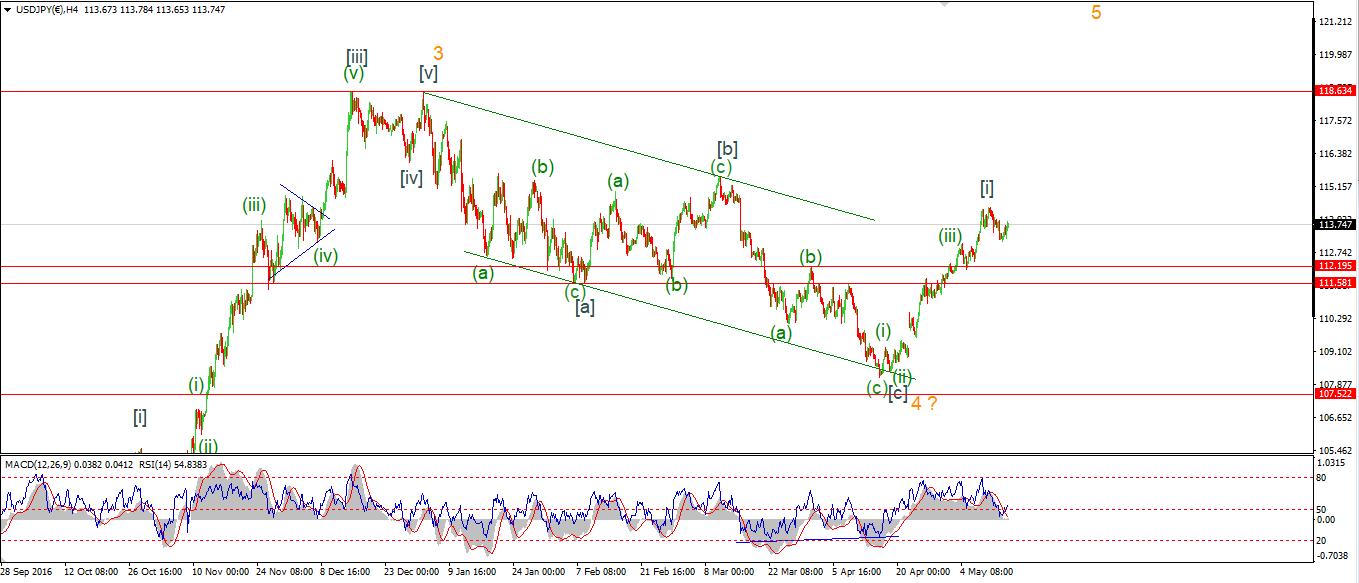
My Bias: LONG Wave Structure: rally in wave [C] Long term wave count: wave [C] is underway, upside to above 136.00 Important risk events: JPY: Prelim GDP q/q. USD: Crude Oil Inventories.
The break of the invalidation line at 112.95 trigger the alternate wave count in USDJPY. Todays low was at 112.92! But in the rules of the wave principle - a break is a break, no matter how little it is. This market is now correcting at one degree higher than previously thought.
I have updated the wave count to indicate the new interpretation. You can see that wave (a) and (b) green are likely complete. And the market is possibly moving in wave (c) green as I write.
The previous fourth wave low of 112.07 is the first target, as I spoke about previously. The Fibonacci extension predicts 112.38 as the low in wave (c), So we have an initial target range to work with from here. For tomorrow wave'a' brown should complete near the lower line of the trend channel. And wave 'b' brown will carry sideways again. We are now looking for a three wave pattern to complete wave (c) green and consequently wave [ii] grey. The next opportunity lies at the lows of wave [ii] grey.
DOW JONES INDUSTRIALS
30 min
4 Hours
Daily
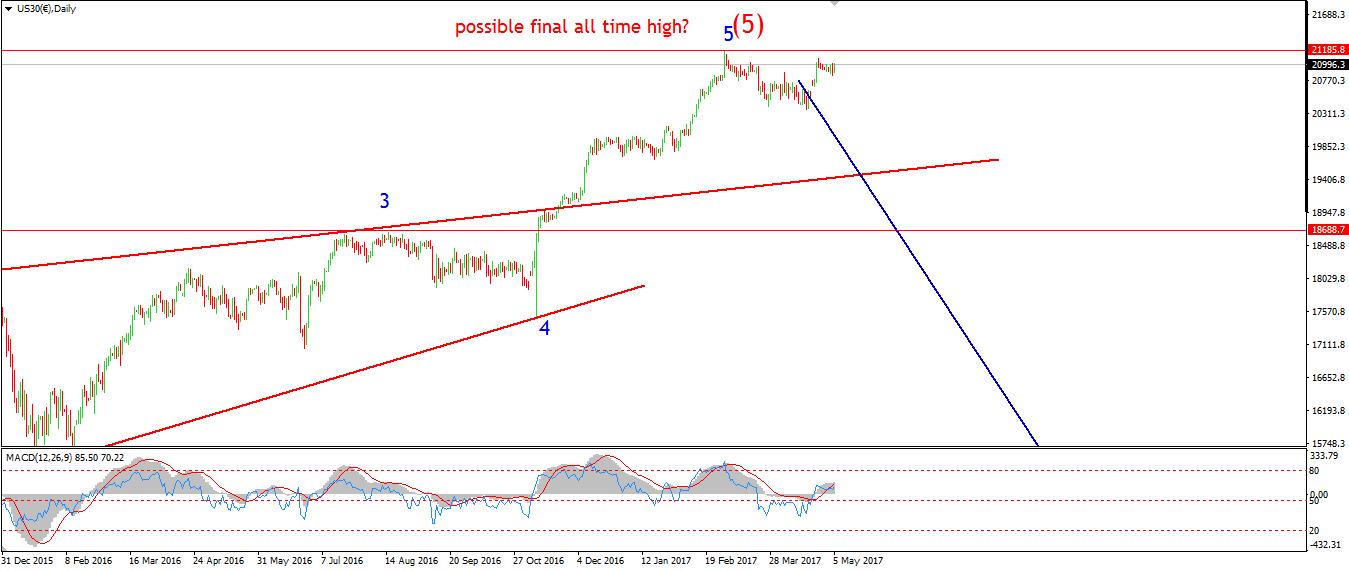
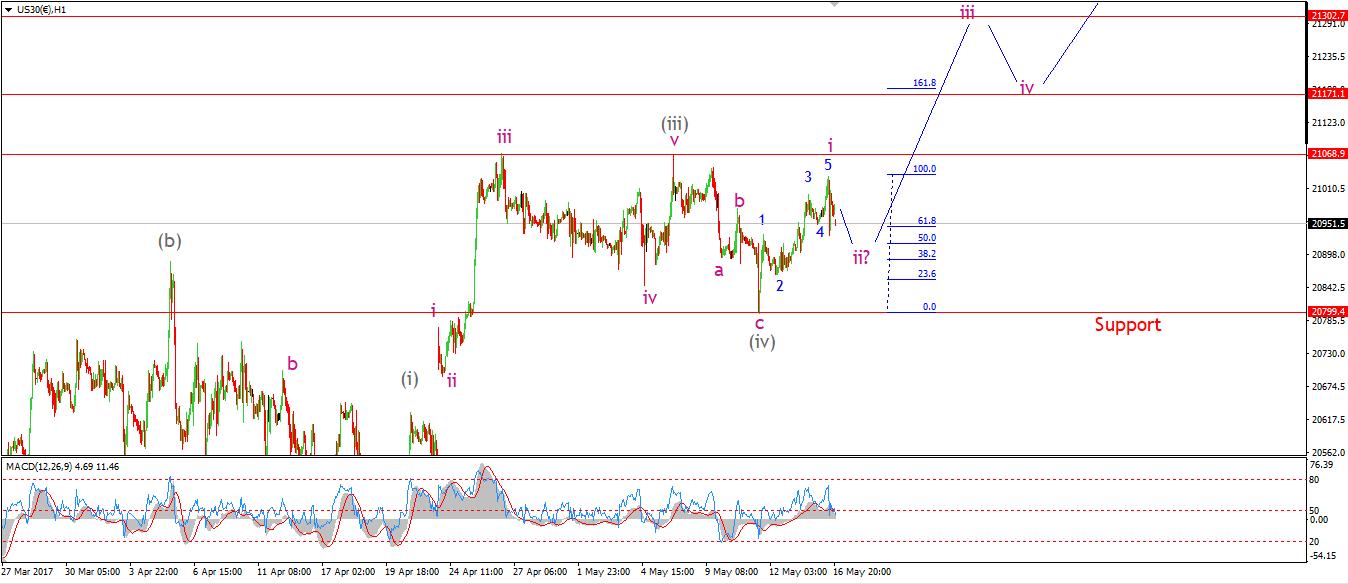
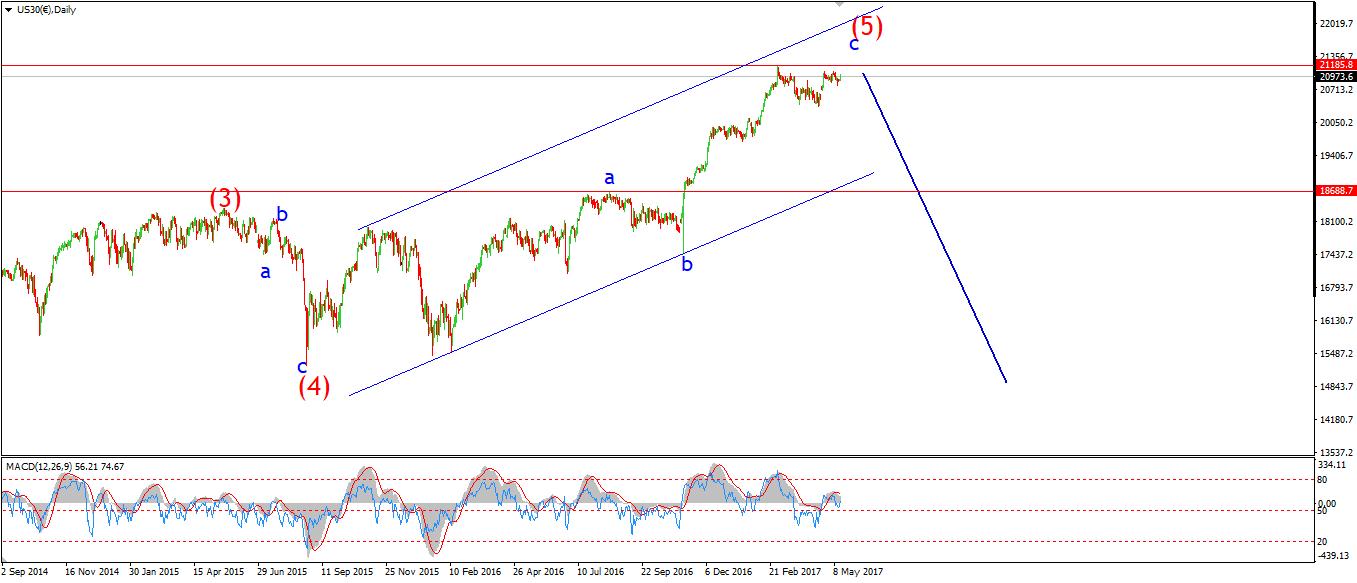
My Bias: market topping process ongoing Wave Structure: Impulsive 5 wave structure, possibly topping in an all time high. Long term wave count: Topping in wave (5) Important risk events: USD: Crude Oil Inventories.
I have altered the short term labeling on the DOW today to show a completed five waves up in wave 'i' pink. The sharp declines this evening is likely the beginning of wave 'ii' pink. 20900 seems a likely target for wave 'ii' as this is about the 50% retracement of wave 'i' pink.
The next rally up in wave 'iii' pink is just around the corner And will likely carry the price into the 21300 area, where wave 'iii' pink will reach 161.8% of wave 'i' pink. For tomorrow I am looking for a low in wave 'ii' after a three wave decline off todays high. The decline has been sharp so far, so it will complete in a similar fashion.
Read more HERE
Read more by Soren K.Group