The VIX Breaks New Ground, the Russell Goes to Sleep
Via t3live.com
Is the market ready to take a break?
Uncle Russell may have just given us a clue.
This morning, the Russell 2000, which has been ripping like crazy, hit yet another all-time high at 1514.77 before reversing down to finish down -0.3% at 1507.76.
This marked the first down down after eight straight up.
Meanwhile, the SPX rose up to hit its own record high at 2540.53 — matching the measured move outlined by Scott Redler last week.
The SPX finished up 0.1% at 2537.74.
The VIX hit a low of 9.53 early this morning, marking the 13th straight day with a low in the VIX below 10.
This is the first such streak in history.
Let me break down just how bizarre the VIX’ behavior is.
Since January, 2, 1990, the VIX has dipped below 10 on exactly 69 days.
50 of these 69 days were after April 2017.
30 of these 69 days have been after June 2017.
Now, on October 6, 2014, the CBOE began using a new method for calculating the VIX to incorporate weekly SPX options.
For the sake of an apple to apples comparison, let’s look at those numbers.
Since then, we have had a total of 51 days with a low in the VIX below 10.
50 of 51 happened after April 2017!
And 30 of 51 happened after June 2017!
This is historic… and insane.
So is it time to bet on a spike in the VIX?
I am considering doing so… but don’t think it’s easy money.
Yes, volatility tends to mean-revert, but good luck figuring out when.
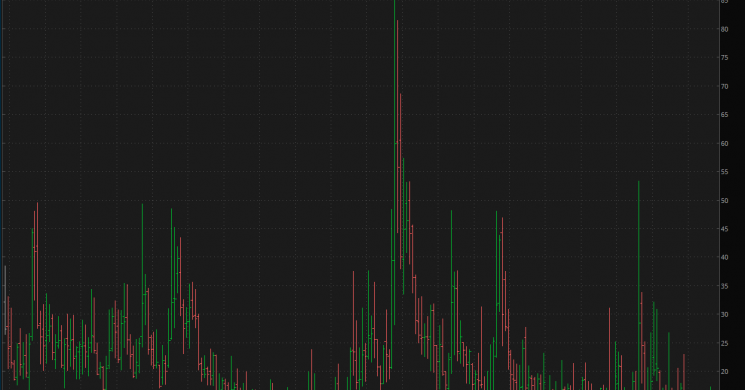
Here is a 20-year monthly chart of the VIX:

As you can see, there have been extended drops in the VIX.
For example, the VIX had multi-year downtrends from 2003-2006 and from 2012-2014.
We very well could be in another one now that extends to 2018 and beyond.
US Treasury yields and the dollar fell today despite strong economic data.
The September Services PMI, ISM Non-Manufacturing Business Activity, and ISM Non-Manufacturing PMI numbers all came in ahead of expectations.
Bank stocks got an initial boost on the news but pulled back.
And on the flip side, gold fell on the data but rebounded to finish strong. As would be expected, gold mining stocks performed well today.
Since Scott Redler nailed the measured move to 2540, let’s look at what he said about the market this morning:
SPY broke out above $250.49 Friday and hit a high of $252.89 yesterday. It’s up 5 sessions in a very methodical move. On the close, I shorted SPY to trade around it. We’ll see how it handles yesterday’s high for adjustments.
With SPY holding and closing above yesterday’s $252.89 all-time high, it certainly looks like the bull move is still intact.
It was disappointing to see the Russell falter today, but let’s remember 2 things:
- Anything that rises 8 days in a row deserves a break
- It only fell -0.3%
Plus, there was at least one sign of strength below the surface today as biotechnology delivered a pretty decent performance today with the Nasdaq Biotech ETF (IBB) finishing up 0.8% at $340.48.
So there are some cracks in the surface, but they’re not very big.
Sentiment is super bullish and technical are stretched… but this market is not broken by any stretch of the imagination.
Read more by Soren K.Group


