Weekend Update:
Gold Trade Recommendation - Analyst
PETRODOLLAR BREAKDOWN: Big Moves In Gold & Silver Ahead
James Rickards on the End of Financial Complacency
In Irma's Wake 'It Looks as if There's No Sea'
Solar Flare May Stop NK Missile Test Saturday
After The Hurricanes: America Can't Afford To Rebuild
Reports Confirm North Korea Can Survive An Oil Embargo
NWO: China Sponsored North Korea is a Nuclear Power
Is Gold on the Verge of Glory?


T3’s Market Wrap: Get Ready for the News
Gold made yet another 2017 high this morning, hitting $1362.40, and 2017 is starting to look like the year of the bug.
Tech has been all the rage, with big cap leaders like Apple (AAPL) and Nvidia (NVDA) taking the lion’s share of attention among the mainstream media.
But look at this chart of QQQ vs. the Gold Miners ETF (GDX) year-to-date:

GDX (the blue line), while clearly more volatile, has been coming on awfully strong since the end of June.
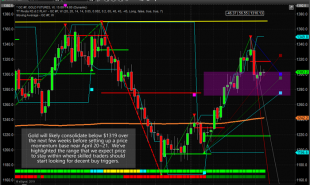
Jeff Cooper believes gold can break 1375:
Something’s in the air and that something ties to what looks like a powerful 3rd of a 3rd wave advance just unfolding following a 5-year bear market into late 2015.
The first 6 months of 2016 represented the first leg up followed by a 6 month correction into late 2016 (wave 2). Gold turned up in early 2017 rallying into April for a wave 1 of 3.
The consolidation into July 2017 looks like a one year high to low cycle which is best counted as a corrective wave 2 of 3. Wave 3 of 3 got underway in August.
The initial push higher here should see last summers high of 1375 exceeded.

(click here for Jeff’s full case on gold)
So why is this happening?
There are three factors at play.
First, there’s just an incredible amount of uncertainty regarding North Korea and the impact of Hurricane Irma.
Then there’s the Fed, which has been growing more dovish because of weak inflation trends.
And finally, there’s time.
Here’s a 20-year monthly chart of gold:

Gold was in a downtrend from the September 2011 top until early 2015.
Eventually, that cycle was going to turn up again.
By the way, if you are interested in gold, I can’t recommend Jeff Cooper’s Daily Market Report enough — Jeff’s gold trades have been killing it.
For now, it looks like market are in a holding pattern ahead of the weekend.
There’s a lot of chatter that North Korea could perform more weapons test this weekend, and traders are concerned about economic interruptions from Hurricane Irma.
Traders are basically waiting to see what happens, which has stocks range-bound and not doing much.
The SPX fell -0.2% at 2461.43.
Meanwhile the Nasdaq was down -0.6% on saggy action in names like the aforementioned Apple and Nvidia.
The Russell 2000, which is in close focus as a barometer of risk, finished up 0.1%.
US Treasury yields bounced back a bit, which drove a big rebound in beaten-down bank stocks. The S&P Financials ETF (XLF) rose 0.9%.
Supermarket chain Kroger (KR) fell -7.5%% despite reporting solid quarterly earnings. Investors are concerned about weakening margins, particularly since Amazon.com’s(AMZN) acquisition of Whole Foods.
Amazon is already cutting prices to boost Whole Foods’ market share.
This is great for consumers, but awful for the competition.
Crude oil fell today due to falling refining activity in the wake of Hurricane Harvey, which is reducing demand for crude oil.
That had energy and oil service stocks near the bottom of my ETF leaderboard.
Taking a look at sentiment, the data shows that traders are somewhat neutral ahead of what could be a news-heavy weekend.
Read more by Soren K.Group