The stock market failed to break above its short-term consolidation on Friday, as investors feared that the Syrian conflict may further escalate. They were right because there was a U.S., U.K. and France air strike on Saturday. However, expectations before the opening of today's trading session are positive and we may see another attempt at breaking higher. Will it be successful?
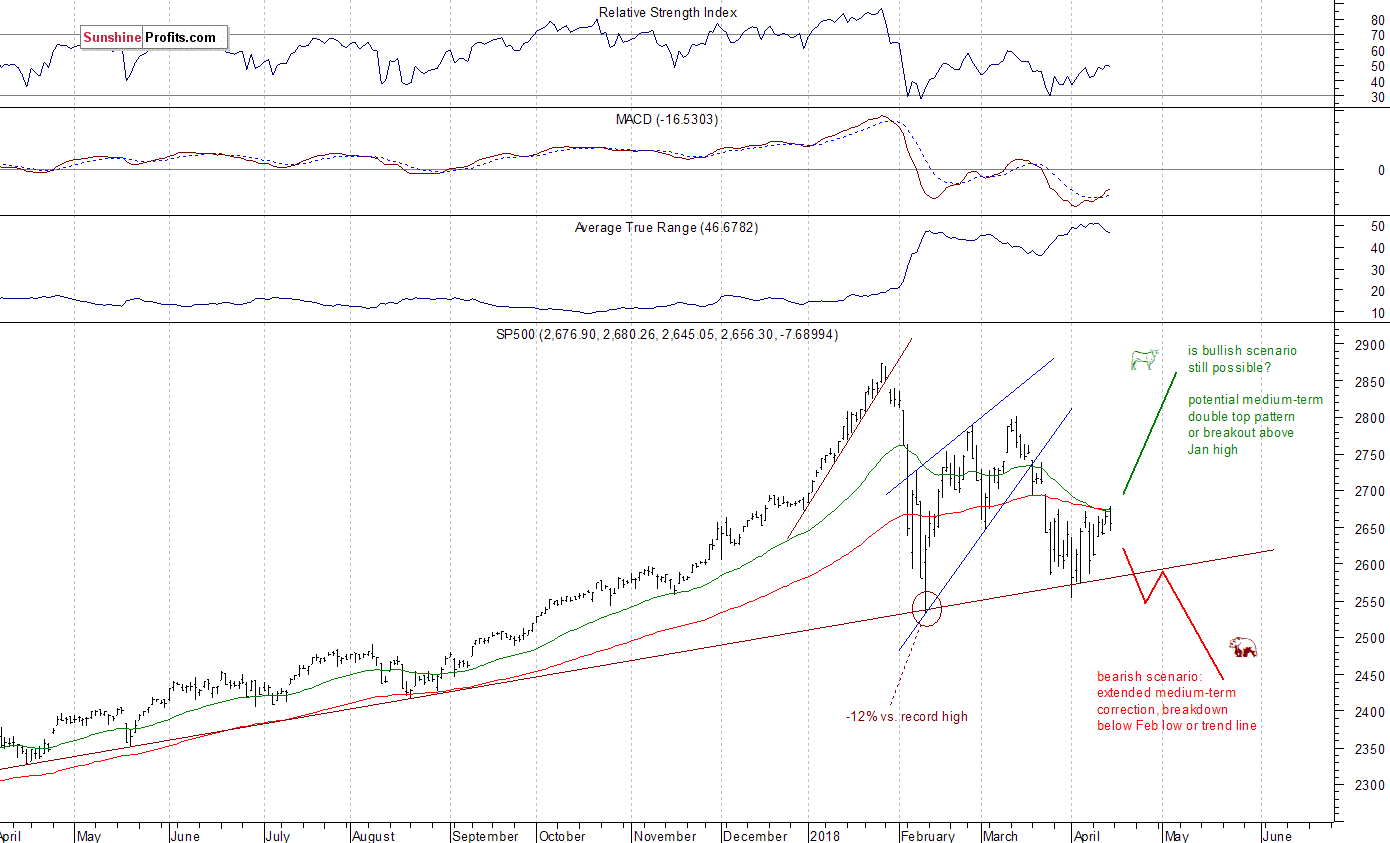
The U.S. stock market indexes lost between 0.3% and 0.5% on Friday, following higher opening of the trading session, as investors were worried about Syrian conflict escalation. The S&P 500 index retraced some of last week's uptrend and it currently trades 7.5% below its January 26 record high of 2,872.87. Both, Dow Jones Industrial Average gained and the technology Nasdaq Composite lost 0.5% on Friday.
The nearest important level of resistance of the S&P 500 index remains at around 2,670-2,680, marked by last weeks' local highs. The resistance level is also at 2,695-2,710, marked by March 22 daily gap down of 2,695.68-2,709.79. On the other hand, the nearest important level of support is at around 2,645, marked by Friday's daily low. The next support level is at 2,635-2,640, marked by local lows.
Stocks reversed their medium-term upward course following whole retracement of January euphoria rally. Then the market bounced off its almost year-long medium-term upward trend line, and it retraced more than 61.8% of the sell-off within a few days of trading. The uptrend reversed in the middle of March, and stocks retraced almost all of their February - March rebound. The index got back down to its medium-term upward trend line. There are still two possible future scenarios. The bearish one, leading us to February low or lower after breaking below medium-term upward trend line, and bullish: medium-term double top pattern or breakout higher. The market was about to break lower over a week ago, but here we are again - closer to breaking higher:
At Recent Local Highs
The index futures contracts trade 0.5% higher vs. their Friday's closing prices right now. The main European stock market indexes have been mixed so far. It means that the expectations before the opening of today's trading session are positive. Will stocks take another attempt at breaking above their short-term consolidation? It may happen if sentiment further improves ahead of coming quarterly earnings releases and today's economic data announcements: Retail Sales, Empire State Manufacturing Index at 8:30 a.m., Business Inventories, NAHB Housing Market Index at 10:00 a.m.
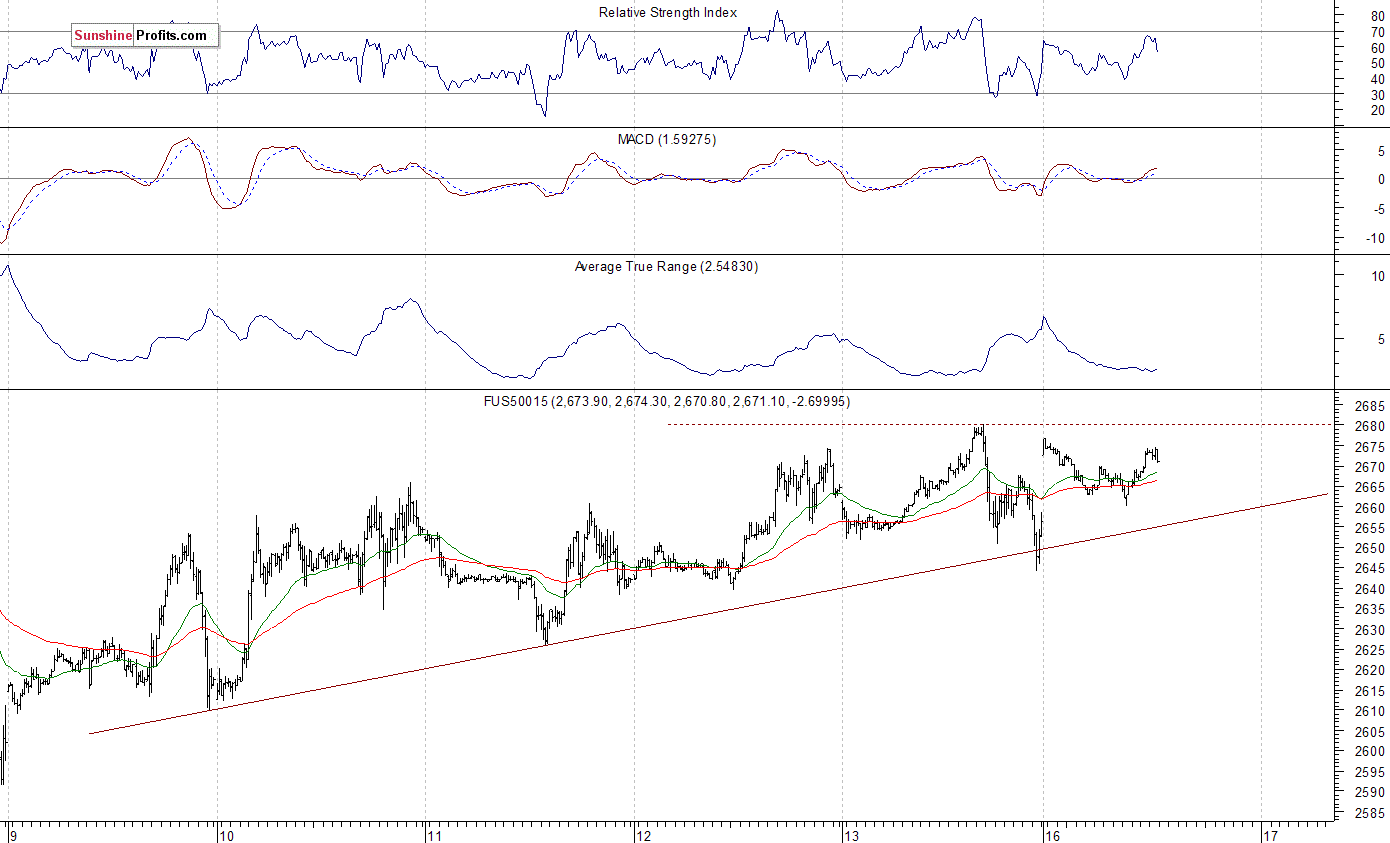
The S&P 500 futures contract trades within an intraday uptrend, as it retraces most of its Friday's move down. The market is closer to breaking above three-week-long consolidation. The nearest important level of resistance is at around 2,675-2,680, marked by some recent local highs. The next level of resistance is at 2,695-2,700, marked by previous support level. On the other hand, support level is now at 2,660, marked by local low. The support level is also at around 2,645-2,650. The futures contract extends its recent fluctuations, as the 15-minute chart shows:
Nasdaq Closer to 6,700 Mark
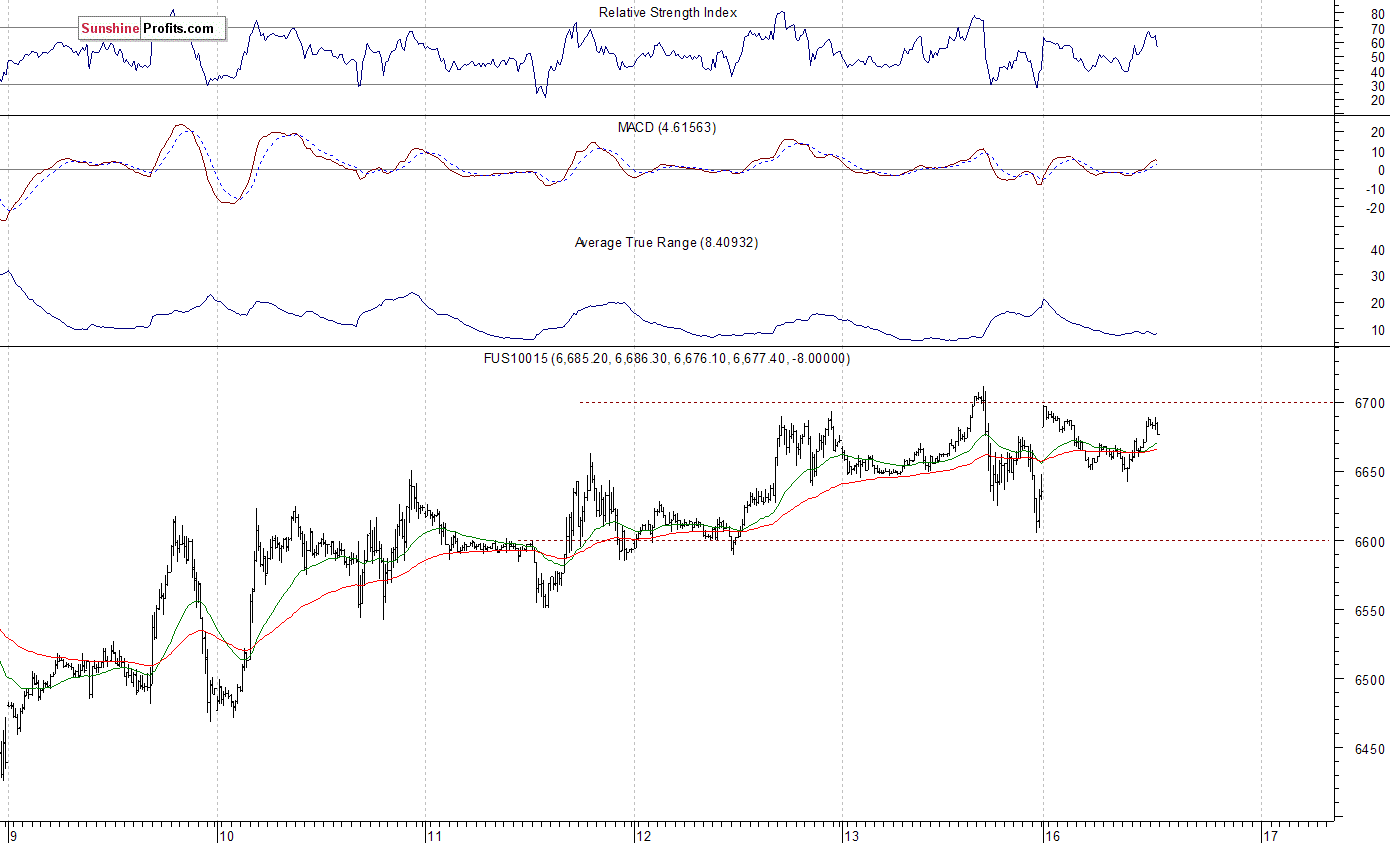
The technology Nasdaq 100 futures contract follows a similar path, as it retraces most of its Friday's move down. The market reached 6,700 mark, after breaking above its short-term consolidation. The volatility remains somewhat lower than a week ago when the index bounced off 6,300 mark. Will tech stocks continue higher and retrace more of their sell-off from mid-March record high? It's hard to say. For now, it looks like an upward correction within a medium-term downtrend. The nearest important resistance level is at around 6,700, and support level is at 6,640-6,650, among others. The Nasdaq futures contract remains within an almost three-day-long horizontal trading channel, as we can see on the 15-minute chart:
Big Cap Tech Stocks - Mixed Picture
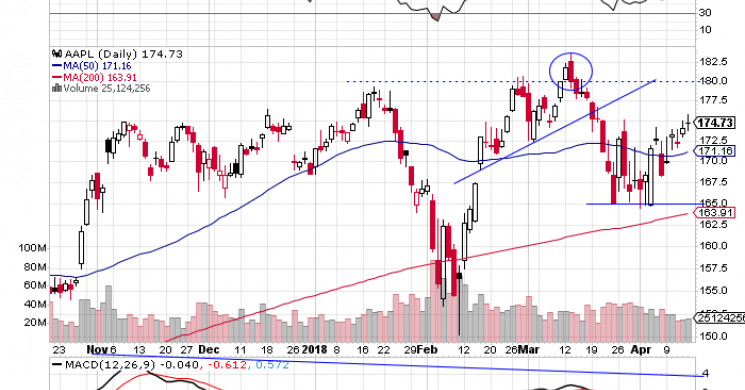
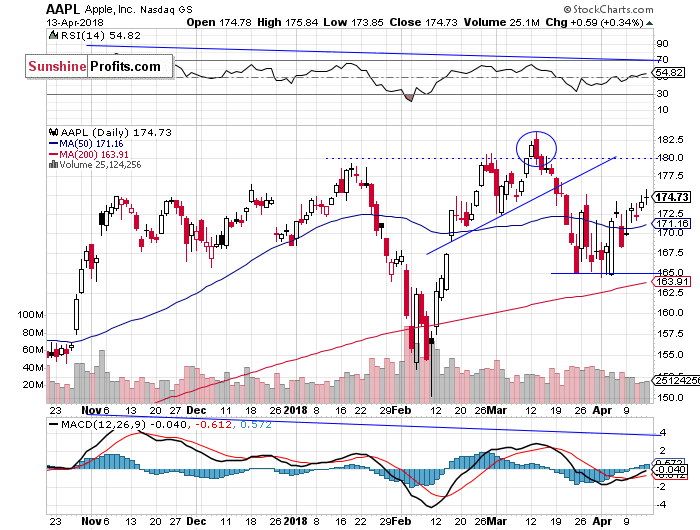
Let's take a look at Apple, Inc. stock (AAPL) daily chart (chart courtesy of http://stockcharts.com). The market broke slightly above its recent trading range recently, but it remained below the resistance level of $175. Is this a new uptrend or just topping pattern before downward reversal? If the market breaks above the resistance level, it could retrace more of March sell-off and get close to record high again. On the other hand, support level is at $165:
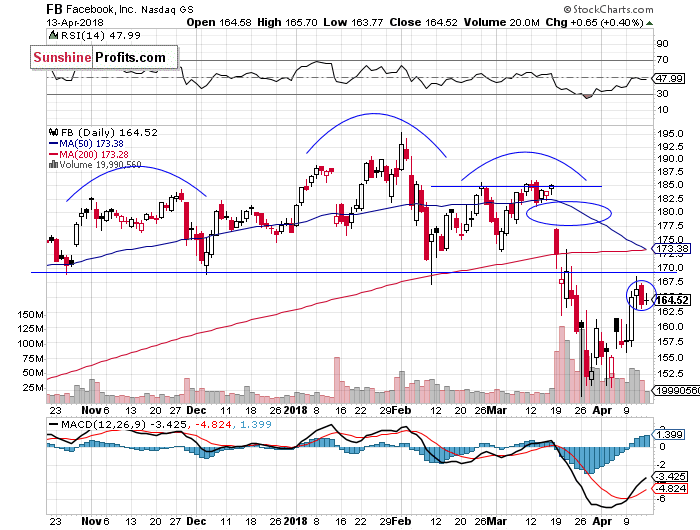
Now let's take a look at Facebook, Inc. (FB) daily chart again. The price broke above its short-term consolidation on Tuesday, as it retraced some of its late March sell-off. Investors' sentiment improved after Mark Zuckerberg' Senate hearing. It continued higher on Wednesday, but failed to extend the short-term uptrend on Thursday. It also formed a negative bearish engulfing candlestick pattern. The price remains below medium-term head and shoulders downward reversal pattern. The nearest important level of resistance is at around $170. On the other hand, support level remains at $150-155, marked by recent local lows:
Dow Jones Bounced Off Downward Trend Line
The Dow Jones Industrial Average reached its medium-term downward trend line on Friday, and it bounced off that resistance level. The market remains within a two-week-long uptrend after forming "Harami" upward reversal candlestick pattern. If it fails to break above the resistance level of around 24,500-24,700, we may see a move lower towards the early April low:
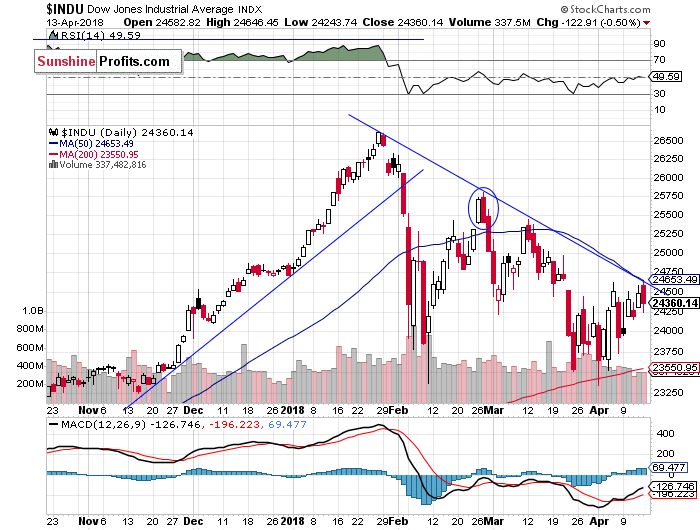
The early March rally failed to continue following monetary policy tightening, trade war fears, among others. What was just profit-taking action, quickly became a meaningful downtrend. Breakdown below over-month-long rising wedge pattern made medium-term bearish case more likely, and after some quick consolidation, the index accelerated towards its early February low. Just like we wrote in our several Stocks Trading Alerts, the early February sell-off set the negative tone for weeks or months to come. However, recent fluctuations may be some bottoming pattern before an upward reversal.
Concluding, the S&P 500 index will probably take another attempt at breaking above its short-term consolidation following overnight move up. Will it succeed this time? There is still some uncertainty over potentially negative global politics news. However, it seems that coming quarterly corporate earnings releases slightly outweigh trade war fears, Syrian conflict escalation worries at this moment.
If you enjoyed the above analysis and would like to receive free follow-ups, we encourage you to sign up for our daily newsletter – it’s free and if you don’t like it, you can unsubscribe with just 2 clicks. If you sign up today, you’ll also get 7 days of free access to our premium daily Gold & Silver Trading Alerts. Sign me up!
Thank you.
Paul Rejczak Stock Trading Strategist Stock Trading Alerts Sunshine Profits - Free Stock Market Analysis
Read more by MarketSlant Editor


