Here's What the Vix is
We think this is a very straight forward and clear way for someone who wants to get a handle on what the VIX is and if it is some sort of predictor of price as the MSM would have you believe.
short answer: It is not. The VIX is in fact worthless as a directional indicator. The financial press just packages it that way to keep you looking at a dumbed down interpretation of a complex instrument. Basically it is marketing triumphing over content quality yet again. More on how we use the VIX later. This is a good primer. It includes term structure (aka futures curve) and how that curve tells an important story. But no derivative predicts price. By definition it is derived form the thing that it measures. Here, the VIX is the market participants' predictions of future price. And keeping it simple, this is a sum zero game. Half of the bets are wrong by definition.
- Vince Lanci
via t3trading
Many traders view the VIX — formally known as the Chicago Board Options Exchange Volatility Index –as a stress gauge for the market.
But knowing the level VIX alone isn’t very helpful, and it has little value as a predictor of price.
One way of getting real value out of the VIX is comparing it to the prices of VIX futures.
The VIX uses implied volatility levels on a variety of S&P 500 options expiring in 30 days to estimate traders’ expectations of volatility.
So if we compare the VIX with prices of VIX futures expiring later in time, we can get an idea of the market’s mood.
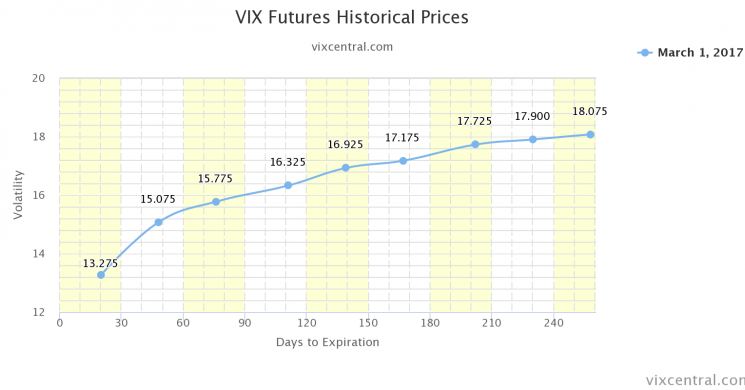
We do this by looking at the VIX curve, which is a plot of VIX future prices by expiration.
Typically, the VIX curve slants up and to the right because the prices of later-dated futures are higher.
Here’s an example from VIXCentral.com:

This is called a state of contango.
If you think about VIX futures as insurance, this makes perfect sense.
Why?
Because when there’s more time to expiration, there’s more of a chance that insurance will pay off.
If you want to buy VIX futures because you think the VIX will spike 25%, you have a far greater chance of having your bet pay off if you have 6 months to expiration rather than 3.
Therefore, the seller of VIX futures will charge higher prices for later-dated futures.
On the flip side, occasionally, the VIX curve will invert — or enter what is called backwardation.
Here is an extreme example from August 24, 2015, when the had a mini-crash:

As you can see, the near-term VIX futures prices are higher than the later-dated ones.
This means that traders expect so much near-term volatility that they’ll pay tremendous amounts of money for near-term VIX futures.
So how can you make sense of all this?
One good rule of thumb is to use the 3-month VIX curve as a proxy for fear in the market.
This is calculated by taking the VIX future expiring in 90 days, and subtracting the VIX spot price from it.
So if the VIX future expiring in 90 days is priced at 15 and the VIX spot price is 11, the 3-month curve is calculated as +4.
And if the VIX future expiring in 90 day is priced at 14 and the VIX spot price is 15, then the 3-month curve is priced at -1.
Generally speaking, here are some 3-month VIX curve levels you can use to determine how optimistic or fearful traders are.
+5: Traders are very bullish and perhaps complacent
+4: Traders are optimistic
+2: Traders are neutral
+1: Traders are moderately bearish
0 or below: Traders are very fearful
Just keep in mind that as with all sentiment indicators, the VIX curve should not be used a buying or selling indicator on its own. Rather, it should be considered as another potentially helpful tool in your decision making process.
Good Luck
About:
Vince Lanci has 27 years’ experience trading Commodity Derivatives. Retired from active trading in 2008, Vince now manages personal investments through his Echobay entity. He advises natural resource firms on market risk. Over the years, his expertise and testimony have been requested in energy, precious metals, and derivative fraud cases. Lanci is known for his passion in identifying unfairness in market structure and uneven playing fields. He is a frequent contributor to Zerohedge and Marketslant on such topics. Vince contributes to Bloomberg and Reuters finance articles as well. He continues to lead the Soren K. Group of writers on Marketslant.
Twitter: VlanciPictures
Website: Echobay.com
Email: vlanci@echobay.com
Read more by Soren K.Group


