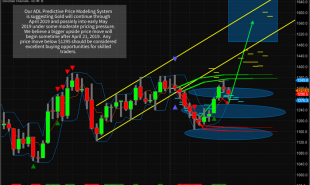
Gold bullion prices increased nearly 3% in January of 2018, following a robust rise in December, and the question on many investors minds is “how far gold bullion can climb in 2018”? One of the best ways to determine what the market is thinking is to evaluate the implied volatility used to price gold bullion options.
What is an Option?
An option is a financial product that gives the buyer of the option the right but not the obligation to purchase or sell an asset such as gold bars or silver coins. There are two types of options, a call option, and a put option. A call option on gold or silver provides the owner the right to purchase gold or silver. A put option allows the owner to sell gold or silver. Each option has an expiration date when the right to purchase or sell the underlying product expires. Additional, options have a price where you can buy or sell the underlying product, which is called the strike price. When you purchase an option, you pay the seller of the option a premium.
What Goes into Pricing an Option?
There are several factors that determine the price of a gold bar or silver bullion option. This is because an option price reflects the probability that gold or silver will be above or below the strike price before the expiration date. Some of the more import factors include the number of days until expiration, the current price gold or silver, the strike price, as well as implied volatility. Implied volatility describes how much the market believes the underlying price of gold bullion or silver bars will move over the next year.
What Can Implied Volatility Tell You?
While many investors who purchase gold bullion or silver coins will never use options, the information that options describe can be an important factor when buying gold bars or silver bullion. Implied volatility tells you how much the market believes prices will move over the next year. Implied volatility comes as a percentage move on an annual basis. For example implied volatility of 14% means that the market believes that prices of gold will move 14% from current levels over the next 12-months.
How Can You Look at Gold Implied Volatility?
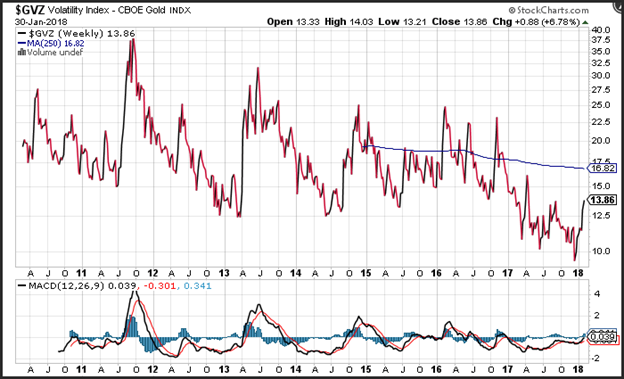
Gold implied volatility can be viewed on a chart using several methods, but the easiest way to evaluate gold implied volatility is chart the Gold CBOE volatility index. This index produced daily by the Chicago Board of Options Exchange (CBOE) shows the implied volatility of the “at the money” strike prices for nearby gold options.
Gold implied volatility hit a fresh all-time low in December at 9.4% and has since rebounded by nearly 50%. The current reading of nearly 14% means that the market believes that prices will rise or fall by 14% in the next 12-months. With gold prices at approximately 1,345, this means that options traders put target prices at either $1,533 or $1,157 at the beginning of February of 2019.
Gold implied volatility is not stagnant and could easily climb back to the 5-year average which is closer to 16.8%. This reading would put prices in the next 12-months at either $1,570 or $1,116. In fact, momentum on gold implied volatility is positive, and will likely continue to climb especially if prices break above current resistance levels near $1,380/$1,390.
Summary
One of the best ways to evaluate how far gold bar prices will likely rise or fall over the next 12-months is to look at gold bullion implied volatility. This is can be accomplished by looking at a chart of the CBOE’s gold volatility index. The index is in percentage terms and tells you how far the options market believes prices will rise or fall over the next year.
Good Investing,
Treasure Coast Bullion Group
Read more by Treasure Coast Bullion Group, Inc - Staff Writer