- Gold is Edging Toward the Strike of Pain
- Total Open Interest at Specific Strike Prices Represents Risk Levels
- There is a Lot of Resistance Near the Strikes of pain
Markets are range-bound approximately 70% of the time, moving sideways as market participants jockey for position. There are several tools that you can use to see the most efficient level to enter the market, and one of the best times is when markets are stopping out of both short and long positions. The options markets can show you where there is going to be lots of activity, as you can evaluate periods where there is abundant open interest and likely a lot of pain.
An option chain will provide you with some pertinent information which will allow you to determine where prices will likely accelerate.
Open Interest
The Chicago Board of Options exchange keeps a running tally of all the contracts that are traded. Open interest reflects the total number of outstanding contracts that are open for a specific strike price. This differs from the volume which represents the total number of contracts traded during the day. The larger the open interest at a specific strike price the most risk there is when the price reaches that price.
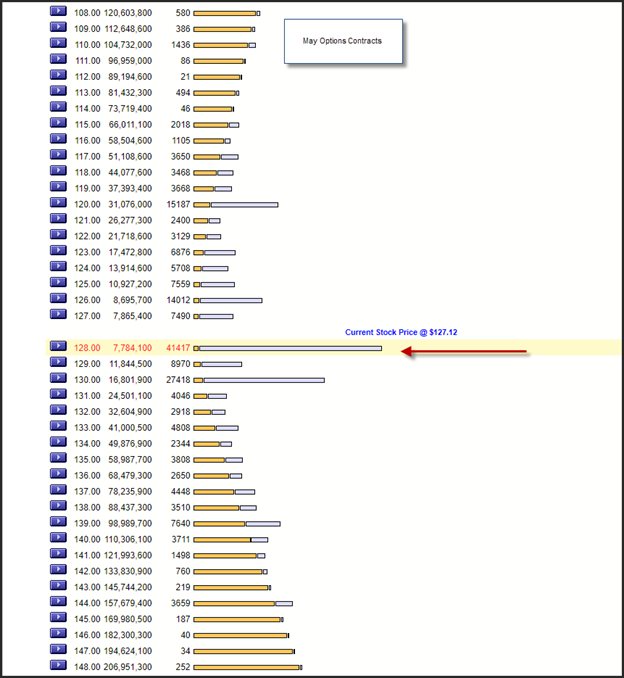
For example, when the price is $127 there are traders that are both short and long calls and puts at that level. At expiration, 50% of the traders will see these options expire worthless, while 50% will see their options expire in the money. If you don’t know until the market closes, you can understand why each strike price represents a lot of risk.
GLD ETF
What you can see from the option chain of the May 18, 2018 calls and puts is that most of the open interest is at the $128 per share level of the GLD ETF which is a gold trust that hold only gold bullion. It does not hold gold producers or refiners just the actual gold bars.
Open Interest Strike Risk
The option chain shows the individual strike prices and the total open interest as well as the strikes where buyers will likely lose the most money and were sellers will gain the most. The total open interest is a very important level. This is the level where the most people will be right, and the most people will be wrong. It its designed in the chart of the option chains with a red arrow. If you are short a call at this level and the price breaks through, you will have to cover or hedge your position. The strike level with the second largest total open interest is just above $128 at $130. Here there are likely lost of short calls that could be covered or naked. This means that many traders will have to cover their short-call position if the price of the GLD continues to climb.
Its also interesting that there is heavy resistance near the $128 strike price and the $130 strike price. This means that many traders have a vested interest in keeping the price capped below the $128 and $130 levels. If prices close above these levels, there will likely be a rush to the door to exit any short call positions. If you think this is a feasible event, you should watch the markets and look to purchase gold bullion above $128 or above $130.
If you are looking to take advantage of a time to add precious metals to your portfolio, click on this link to get access to your Investment Kit or better yet, give us a call today at 800–982–6105.
Want to read more articles like this? Sign up for our free e-newsletter, and you'll learn when new articles have been published. To see a list of recent articles visit our Treasure Coast Market News page.
Good Investing,
Treasure Coast Bullion Group
Read more by Treasure Coast Bullion Group, Inc - Staff Writer