
Friday marked the ninth anniversary of the stock bull market, the second longest since World War II following the spectacular run in the 1990s that finally met its match when the tech bubble burst in March 2000. The current expansion, which some consider the “most hated bull market in history,” has largely been fueled by extraordinarily accommodative monetary policy in the form of massive money printing and near-zero interest rates. It’s withstood a number of significant headwinds, including a relatively slow economic recovery, the collapse in the price of oil and other commodities, ongoing conflict in the Middle East and an especially nasty presidential campaign cycle. If it can avoid dropping more than 20 percent in the next six months, it will become the longest-lasting ever.

No doubt you’ve heard before that bull markets don’t die of old age. I can’t say for sure what will end this particular business cycle—no one can—but we’re seeing huge shifts in monetary and fiscal policy right now that investors can’t afford to ignore. As I often say, government policy is a precursor to change.
Unintended Consequences of Steel Tariffs
For one, the decade-long era of easy money is coming to an end. The Federal Reserve is unwinding its enormous balance sheet, its enormous balance sheet, which carries some risk.
Meanwhile, the Trump administration is ratcheting up its protectionist trade policies. After surprising markets in recent days with plans to impose tariffs on steel and aluminum imports, President Trump signed the authorization Thursday afternoon, applying taxes broadly to all countries except Canada and Mexico. It was greatly feared that Canada, the number one supplier of steel and aluminum to the U.S., would be included, but it appears someone managed to change the president’s mind. When former President George W. Bush imposed a steep 30 percent tariff on steel imports in 2002, Canada was likewise spared.
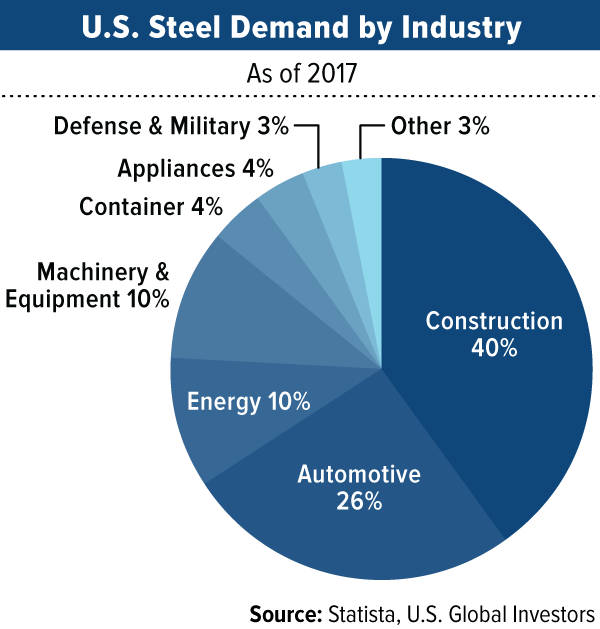
The 2002 tariff, by the way, had some serious unintended consequences that critics of Trump’s policy hope are not repeated. A report put out by the Consuming Industries Trade Action Coalition (CITAC)found that about 200,000 Americans, in every U.S. state, lost their jobs in 2002 as a result of higher steel prices, representing some $4 billion in lost wages. More people, in fact, lost their jobs than the total number of people working in the domestic steel industry itself. Not surprisingly, a quarter of lost jobs occurred in steel-consuming industries such as machinery and equipment, automotive and parts manufacturers.
To be clear, U.S. steel companies did benefit from the tariffs, with profits in the first three quarters of 2002 rising $2.1 billion. This growth was offset, though, by a $15 billion decline in profits for steel-consuming companies.
Today, representatives of those same industries warn that the current tariffs could do more harm than good.
Roy Hardy, president of the Precision Metalforming Association, claims that they “will damage downstream U.S. steel and aluminum consuming companies.” Hardy estimates the tariffs could cost the U.S. economy 146,000 jobs this year alone, a figure that—as was the case in 2002—outnumbers the 140,000 Americans currently employed by the domestic steel industry.
As many as 107 House Republicans expressed deep concerns last week, writing in an open letter to the president that the “new taxes in the form of broad tariffs would undermine” the “remarkable progress” made by the tax overhaul. Meanwhile, outgoing Republican Senator Jeff Flake of Arizona said he would introduce a bill that would block Trump’s tariffs.
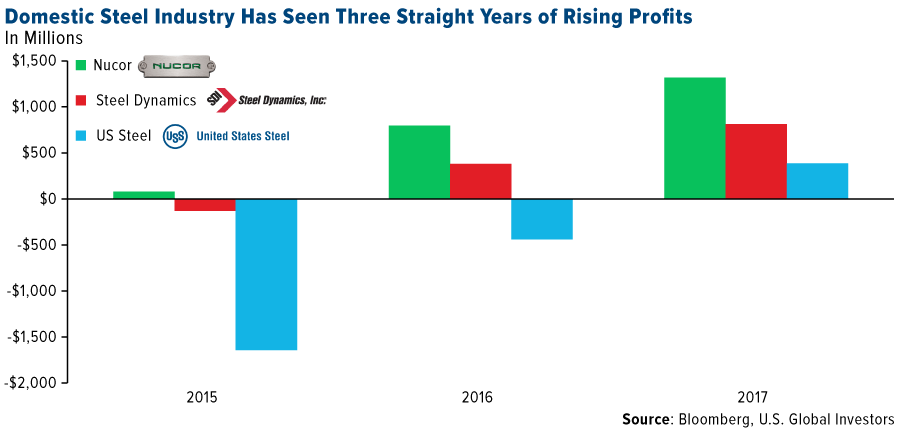
The tariffs come at a time when domestic steel producers’ balance sheets are steadily improving. According to Bloomberg data, the industry posted net profits totaling $2.5 billion in 2017, up from $60 million in 2016. The group lost a whopping $2.5 billion in 2015, with Pittsburgh-based U.S. Steel contributing the heaviest losses at $1.6 billion.
In the coming days and weeks, the tariffs should serve to boost domestic steel production and employment. The Wall Street Journal reports that U.S. Steel has plans to reopen a blast furnace in Granite City, Illinois, and call back 500 workers. This follows an announcement by Century Aluminum that it will double its workforce to 600 at a Kentucky smelter.
I’m pleased to hear this news but remain skeptical on the long-term impact. The U.S. now faces retaliation from its trading partners, from China to the European Union.
A Recession in the Near Term Doesn’t Look Likely
Despite some of the negativity, I see no cause for alarm with regard to the U.S. economy. The country added a whopping 313,000 jobs in February, the most since July 2016 and the 89th straight month of gains—a new record. Economists had anticipated only 200,000. Earlier, Moody’s chief economist Mark Zandi called the job market “red hot,” adding that with “government spending increases and tax cuts, growth is set to accelerate” even more.
One of the most historically reliable economic indicators currently looks very healthy. The Conference Board Leading Economic Index (LEI) opened 2018 on sure footing, posting a 108.1 in January, up a full percent from the previous month. The reading reflects “an economy with widespread strengths coming from financial conditions, manufacturing, residential construction, and labor markets,” the Conference Board writes.
According to FactSet, a record number of S&P 500 companies have issued positive earnings per share (EPS) guidance for 2018. The financial data firm classifies positive guidance as an EPS estimate that’s higher than the mean estimate before the guidance was issued. As many as 127 companies shared positive EPS guidance for the year, more than double the 10-year average of 49 companies for the same period. FactSet attributes this optimism to tax reform, an improving global economy and weaker U.S. dollar.

And it’s not just large S&P 500 companies that are feeling confident. January’s Small Business Optimism Index found that a record percentage of small business owners are eager to expand. Thirty-two percent of owners said that “now is a good time to expand,” the highest such reading in the survey’s 45-year history.
Could Fertility Be a Leading Economic Indicator?
On a final note, a new study lends additional credibility to the theory of “wisdom of crowds,” which states that large groups of people are smarter and better at analyzing data than an elite few. In one recent example, I showed you how investors accurately predicted the election of Donald Trump as far back as July 2016.
But could declining fertility rates predict the next recession? A team of researchers from the University of Notre Dame thinks so, and they have some compelling evidence to support their idea.
Granted, there's nothing unique about the idea that birth rates drop during and after economic downturns. Married couples have tended to put off expanding their families when they see friends and neighbors being laid off and a greater number of foreclosed homes in their neighborhoods.
What makes this study worth discussing is that it suggests conceptions, those that result in live births, noticeably begin to drop months before a recession strikes. This pattern, according to the study’s authors, can be observed in recessions beginning in 1990 and 2001, as well as the Great Recession.
Above, you can see the percent change in conception rates tumbled sharply sometime before GDP growth began to stall or even reverse course. Conception, then, could be used to anticipate recessions just as well as any other economic indicator.
In fact, conception rates could end up being even more accurate “in situations where employment significantly lags the overall economy, and where conceptions lead the economy,” the authors write.
So how are families able to anticipate and act on economic trends more reliably than professional economists? Again, the wisdom of crowds prevails. Everyday people no doubt sense the tremors before the earthquake by hearing things in their firms and comparing observations with friends and acquaintances. There’s no way to quantify this, of course, but live birth records in the U.S. are readily available.
You might be wondering what the data tells us about the economy’s health in the near term. Sadly, the study makes no mention of this. But in January, the Pew Research Center reported that U.S. fertility rates fell to 62 births per 1,000 women of childbearing age in 2017—a new all-time low.
Before you begin to panic, though, it’s important to know that there are different ways to measure fertility, which could skew the data. Also, the drop in fertility could just be further evidence that young adults are choosing to delay starting a family.
Regardless of the rate, people will continue to have babies, increasing the need for even more raw materials and resources.
Craving even more expert insight on global markets, gold, cryptocurrencies and behavioral finance? Join thousands of other curious investors like you and sign up to receive my award-winning CEO blog, Frank Talk! It's FREE!
All opinions expressed and data provided are subject to change without notice. Some of these opinions may not be appropriate to every investor. By clicking the link(s) above, you will be directed to a third-party website(s). U.S. Global Investors does not endorse all information supplied by this/these website(s) and is not responsible for its/their content.
The S&P 500 Index is a stock market index that tracks the 500 most widely held stocks ?on the New York Stock Exchange or NASDAQ.
The Small Business Optimism Index is compiled from a survey that is conducted each month by the National Federation of Independent Business (NFIB) of its members.
The Conference Board Leading Economic Index is an American economic leading indicator intended to forecast future economic activity. It is calculated by The Conference Board, a non-governmental organization, which determines the value of the index from the values of ten key variables.
Holdings may change daily. Holdings are reported as of the most recent quarter-end. None of the securities mentioned in the article were held by any accounts managed by U.S. Global Investors as of 12/31/2017.
Read more by Frank Holmes


